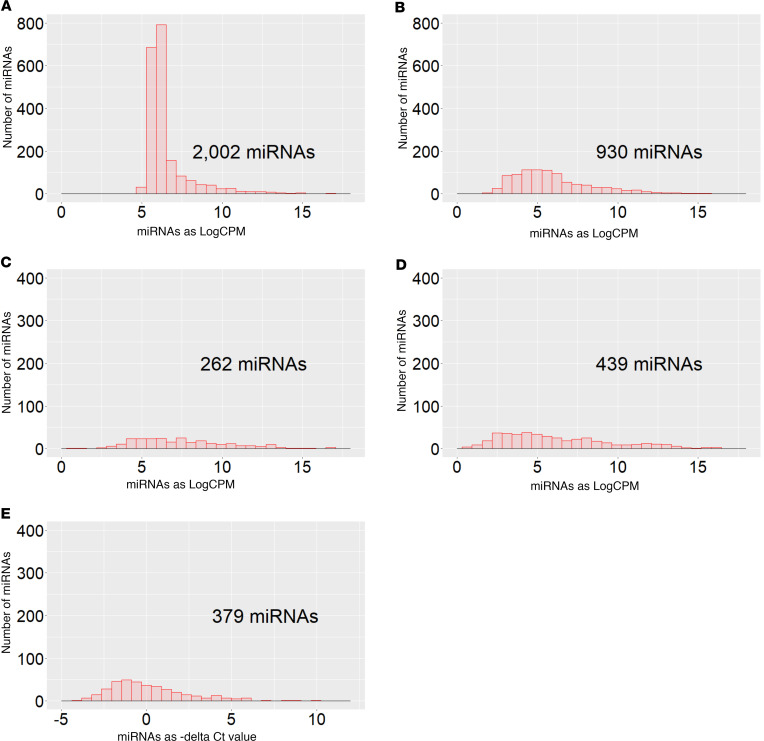
Figure 1. Distributions of number of detected cfmiRNAs according to raw read count of miRNAs in study panels, according to used platforms for quantification of cfmiRNAs.
(A) cfmiRNAs in plasma quantified by the HTG EdgeSeq platform. (B) cfmiRNAs in RNA extracted from plasma quantified by EdgeSeq. (C) cfmiRNAs in RNA extracted from plasma and quantified by RNASeq_1 (SeqMatic). (D) cfmiRNAs in RNA extracted from plasma and quantified by RNASeq_2 (LC Sciences). (E) miRNAs in RNA extracted from pooled plasma and quantified by qRT-PCR. The cfmiRNAs were considered detectable if they had concentrations of more than 1 CPM in more than 80% of the samples (7 or more samples out of 8) in EdgeSeq or in more than 50% of the samples in RNA-Seq or Ct values less than 30 in qRT-PCR.

