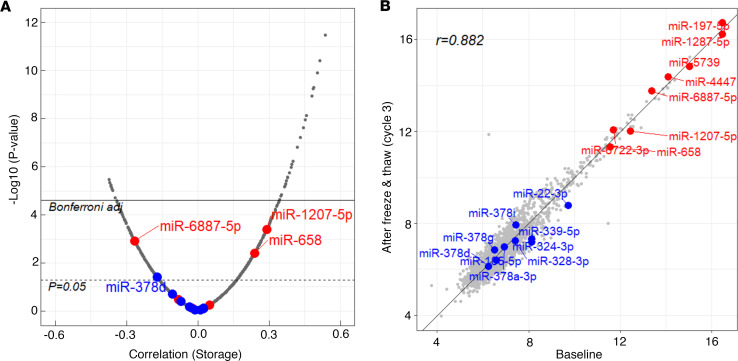
Figure 3. Stability of miRNAs in plasma and duration of storage and freeze/thaw cycles.
(A) Volcano plot of Spearman correlation coefficients between miRNA concentrations in whole plasma and duration of plasma storage in individuals in panel 3 (N = 145). Red dots indicate risk ESKD-associated miRNAs, and blue dots indicate protective ESKD-associated miRNAs. The mean ± SD of storage duration (years) was 9.3 ± 2.3 years. (B) Comparison of plasma miRNA concentrations between baseline and after 3 cycles of freeze and thaw using Spearman correlation.

