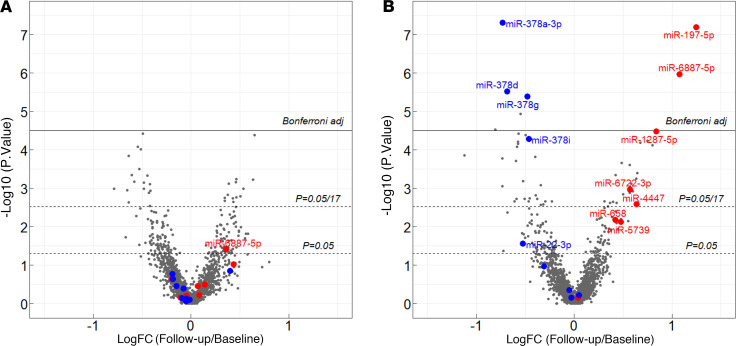
Figure 4. FCs of concentration of cfmiRNAs measured with EdgeSeq platform in whole plasma obtained at follow-up over concentration of miRNAs in whole plasma obtained at baseline, from individuals in panel 4 (N = 96).
(A) Results obtained for 52 T1D individuals who did not progress to ESKD during 7–15 years of follow-up. Median (25th % and 75th %) of duration between baseline and follow-up measurements was 3.7 (2.2, 5.3) years. (B) Results obtained for 44 T1D individuals who progressed to ESKD during 7–15 years of follow-up. Median (25th % and 75th %) of duration between baseline and follow-up measurements was 4.1 (2.5, 6.3) years. Red dots indicate risk miRNAs and blue dots indicate protective cfmiRNAs. A paired nonparametric analysis using the Wilcoxon rank sum test was used for comparison.

