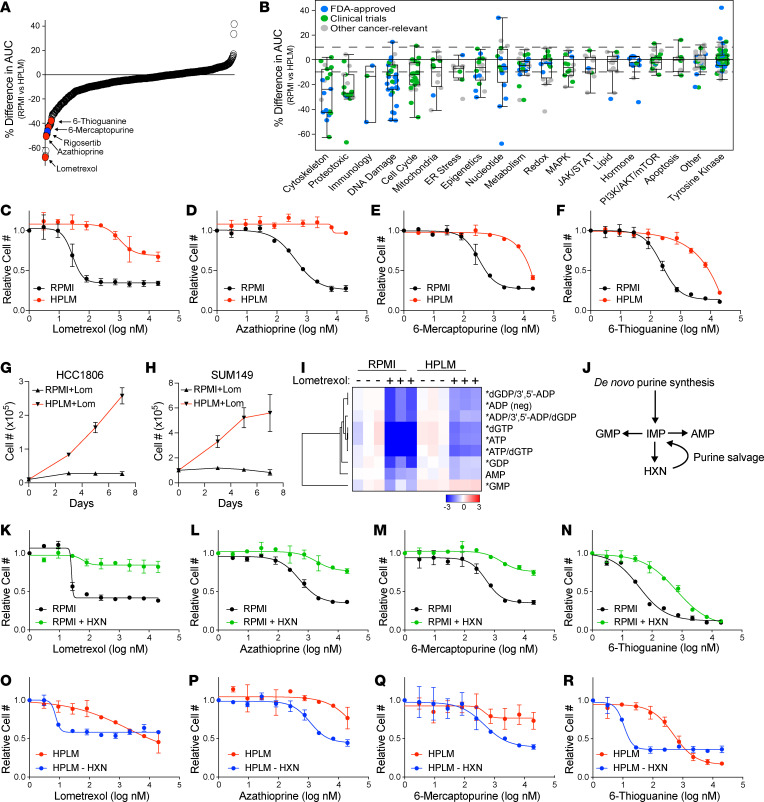
Figure 1. Culture in HPLM changes sensitivity to a variety of therapeutic agents.
(A) Percentage difference in the area under curve (% difference in AUC) data for SUM149 cells cultured in either RPMI or HPLM after treatment with anticancer and metabolic inhibitor libraries. Only compounds with a maximum effect of more than 50% in either medium are shown. (B) The same data as in A categorized based on target pathway. Box plots show the interquartile range, median (line), and minimum and maximum (whiskers). (C–F) Dose-response curves of the purine biosynthesis inhibitors lometrexol (C), azathioprine (D), 6-mercaptopurine (E), and 6-thioguanine (F) on SUM149 cells growing in RPMI versus HPLM. (G and H) Growth curves of HCC1806 (G) and SUM149 (H) cells treated with lometrexol in RPMI versus HPLM. (I) LC-MS analysis to quantify purine nucleotide abundance in HCC1806 cells treated with lometrexol in RPMI versus HPLM. * indicates P < 0.05 for HPLM + lometrexol relative to RPMI + lometrexol (unpaired 2-tailed t test). (J) Schematic representation of purine synthesis and salvage pathways. (K–N) Dose-response curves of the purine biosynthesis inhibitors lometrexol (K), azathioprine (L), 6-mercaptopurine (M), and 6-thioguanine (N) on SUM149 cells grown in RPMI with and without hypoxanthine (HXN). (O–R) Dose-response curves of the purine biosynthesis inhibitors lometrexol (O), azathioprine (P), 6-mercaptopurine (Q), and 6-thioguanine (R) on SUM149 cells grown in HPLM with and without HXN. For all panels data represent the means ± SD of triplicate samples.

