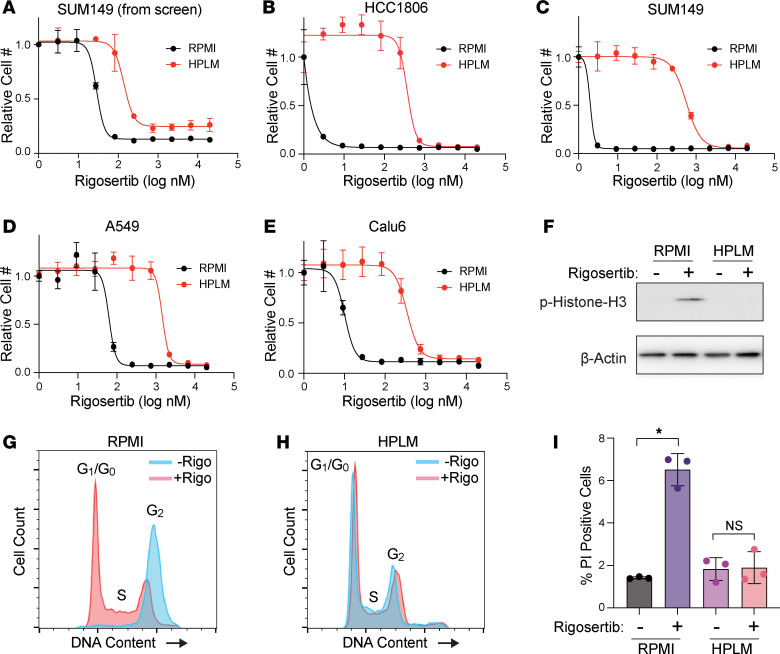
Figure 2. Culture in HPLM reduces sensitivity to rigosertib.
(A) Dose-response curve of SUM149 cells treated with rigosertib from the high-throughput screen described in Figure 1. Data are the mean ± SD of triplicate samples. (B–E) Dose-response curves for rigosertib treatment of HCC1806 (B), SUM149 (C), A549 (D), and Calu6 (E) cells growing in RPMI versus HPLM. Data are the mean ± SD of triplicate samples. (F) Representative Western blot of phosphorylated histone H3 in HCC1806 cells treated with 150 nM rigosertib in RPMI versus HPLM. (G and H) Cell cycle analysis of HCC1806 cells treated with 150 nM commercial-grade rigosertib in RPMI (G) and HPLM (H). (I) Cell death analysis of HCC1806 cells treated with 200 nM commercial-grade rigosertib in RPMI versus HPLM. PI, propidium iodide. Cell death and cell cycle data are the means ± SD of triplicate samples. * indicates P < 0.05 by unpaired 2-tailed t test.

