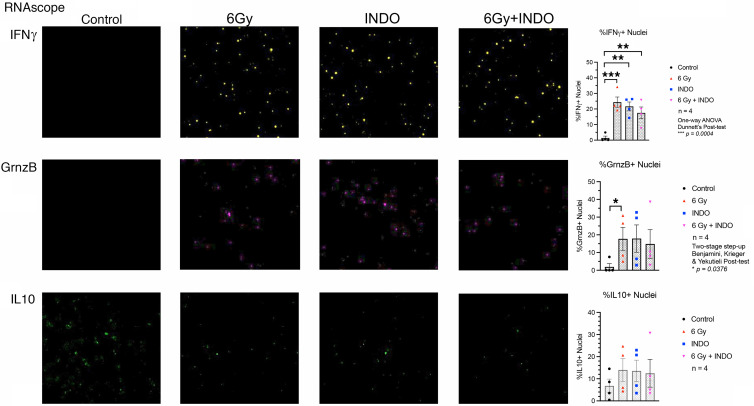
Figure 5. RNAScope analysis of IFN-γ, GrnzB, and IL-10.
Increased expression of IFN-γ and GrnzB supportive of elevated cytolytic CD8+ T cell phenotypes were measured in treated tumors on day 7 after IR. No significant changes in IL-10 expression were observed. *P < 0.05, **P < 0.006, ***P = 0.0004 using 1-way ANOVA with Dunnett’s post hoc test or Kruskal-Wallis with Benjamini, Krieger, & Yekutieli 2-stage step-up post hoc test. Magnification, ×20.

