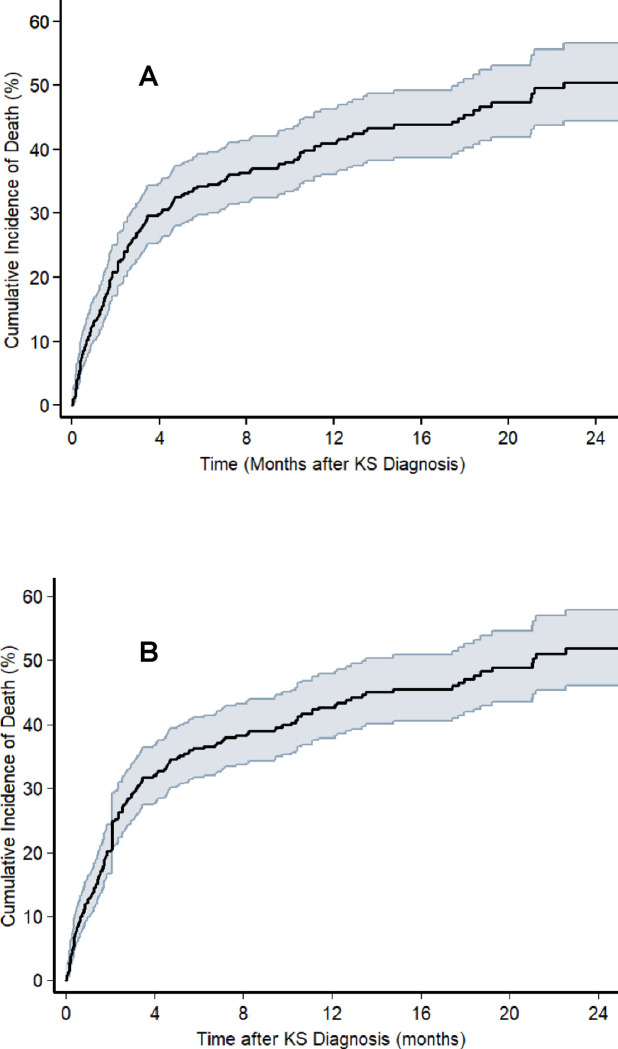
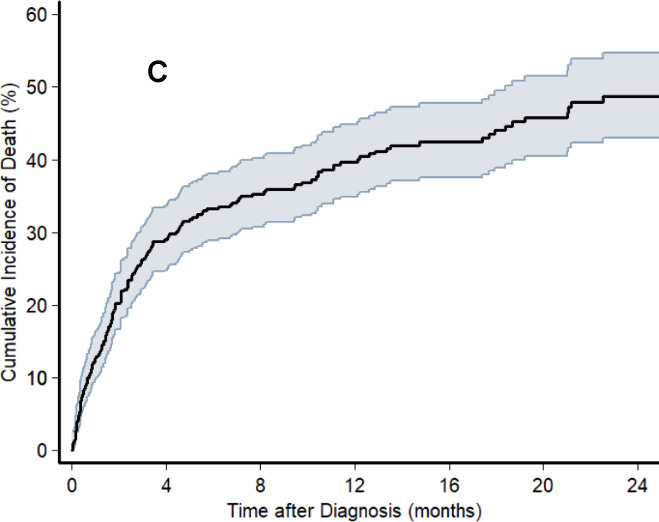
Figure 3.
Cumulative incidence of death, as determined by the Kaplan-Meier estimator, following diagnosis of KS among adults living with HIV with newly diagnosed Kaposi sarcoma between 2016 and 2019 at one of three health systems in Kenya and Uganda. The shaded area represents the 95% confidence interval around the cumulative incidence estimate. Panel A depicts the base-case analysis in which participants who became lost to follow-up were censored on the last date they were known to be alive. Panel B depicts a sensitivity analysis in which participants who became lost to follow-up were classified as dead the day after they were last known to be alive (“worst case” mortality). Panel C depicts a sensitivity analysis in which participants who became lost to follow-up were classified as alive as of the date of administrative censoring for the study population (“best case” survival).


