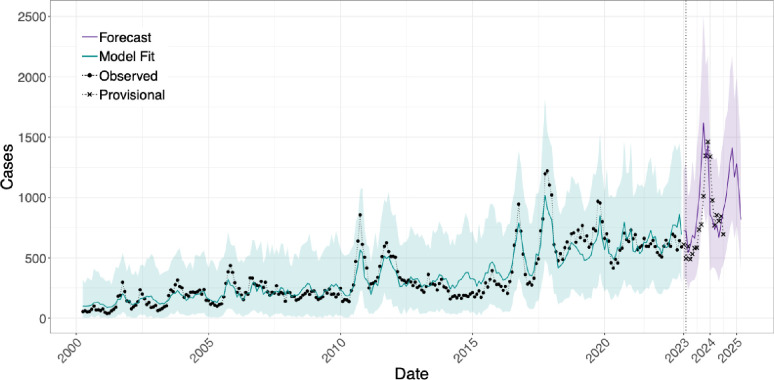
Fig. 2.
Statewide monthly coccidioidomycosis cases, 2000–2024. Black dots indicate confirmed cases reported between 2000–2022, x’s indicate the provisional cases reported between Jan. 1, 2023, and Jul. 31, 2024, the green line represents the ensemble model fit to the observed case data (R2 = 0.87), and the purple line indicates the ensemble model predicted (Apr. 1, 2023 – Mar. 31, 2024) and forecasted (Apr. 1, 2024 – Mar. 31, 2025) cases between Apr. 1, 2023, and Mar. 31, 2025. 90% prediction intervals are represented by the colored bands.

