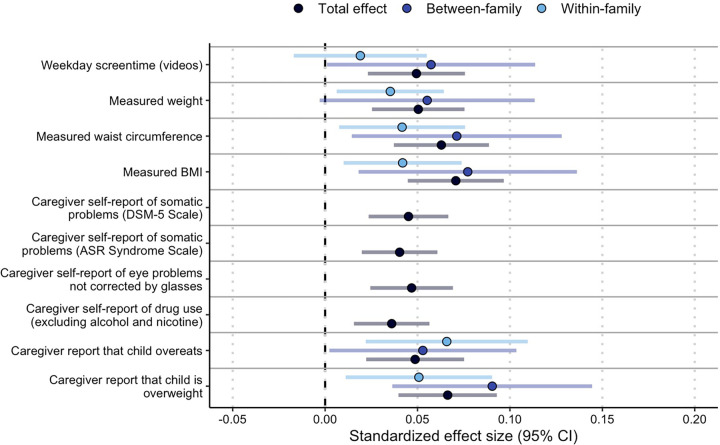
Figure 2.
β coefficients and 95% confidence intervals for the nine phenotypes that survived FDR correction for multiple testing and one phenotype that was trending toward significance in the CRP PRS PheWAS of psychosocial phenotypes. Total effect is the effect in the full sample; between- and within-family effects were run in a sample restricted to sibling groups. Caregiver self-report phenotypes were not included in the within/between family analysis, as answers are expected to be the same for most sibling groups.

