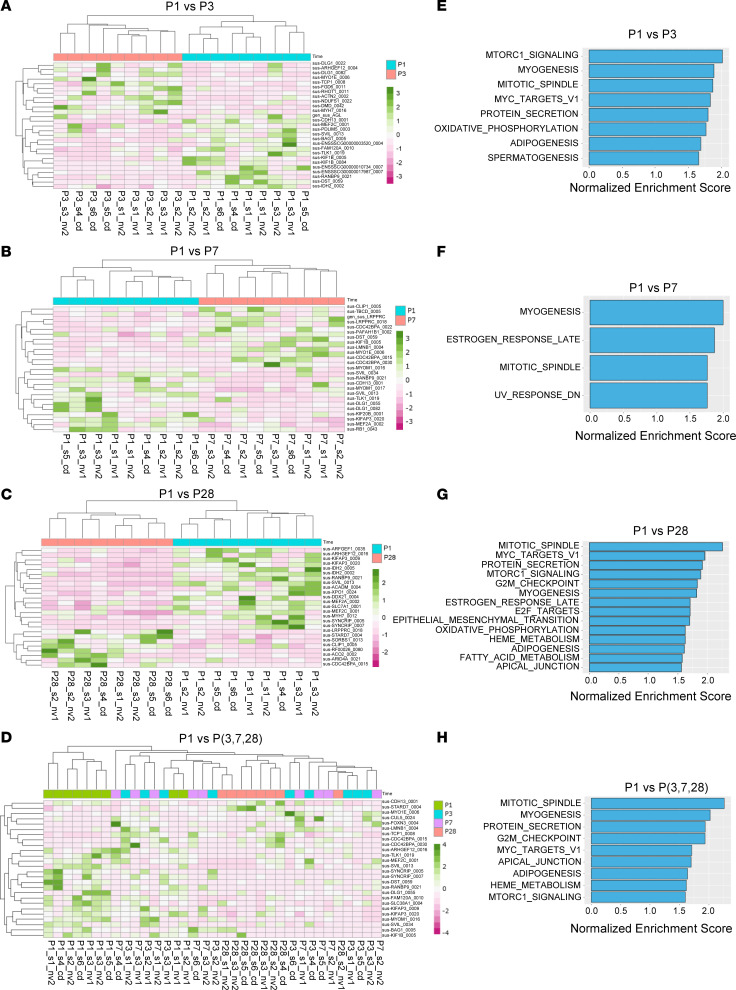
Figure 1. Differentially expressed circRNAs in neonatal pig hearts and functional enrichment analysis.
(A–D) A heatmap of differentially expressed and cell cycle–related circRNAs depicting expression patterns from various comparisons including P1 versus P3 (A), P1 versus P7 (B), P1 versus P28 (C), and P1 versus P3, P7, and P28 (D). circRNAs with high expression values are colored in dark green while those with low expression values are in dark pink. (E–H) Pathway enrichment analysis plots of top ranked cell cycle–related hallmark pathways from various comparisons including (E) P1 versus P3, (F) P1 versus P7, (G) P1 versus P28, and (H) P1 versus P3, P7, and P28. Panels A–H were generated using circRNA data from 35 batch-corrected RNA samples obtained from 24 pig hearts sequenced by CD Genomics Inc. (“cd”), and Novogene Inc. (“nv1” and “nv2”).

