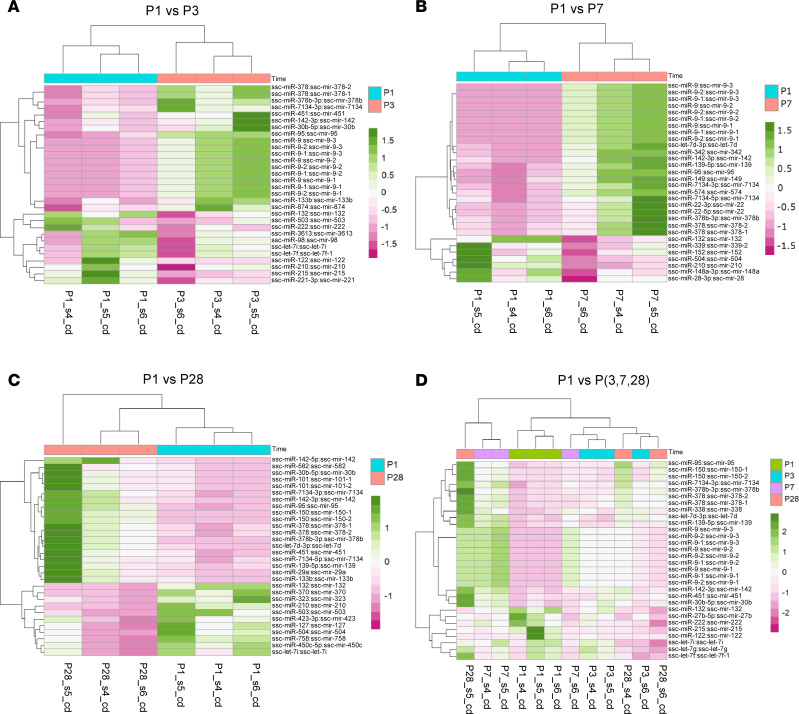
Figure 2. Differentially expressed miRNAs in neonatal pig hearts and functional enrichment analysis.
(A–D) A heatmap of top 30 differentially expressed miRNAs depicting time-specific expression patterns in different experimental designs including (A) P1 versus P3, (B) P1 versus P7, (C) P1 versus P28, and (D) P1 versus P3, P7, and P28. circRNAs with high expression values are colored in dark green while those with low expression values are colored in dark pink. The heatmap plots displayed indicate noticeable differences in expression patterns (either higher or lower) at P1 compared with the other days, suggesting a significant alteration in the expression of miRNAs during the postnatal development of pig hearts. All panels were generated using miRNA data from 12 RNA samples obtained from 12 pig hearts at different postnatal days (P1, P3, P7, and P28).

