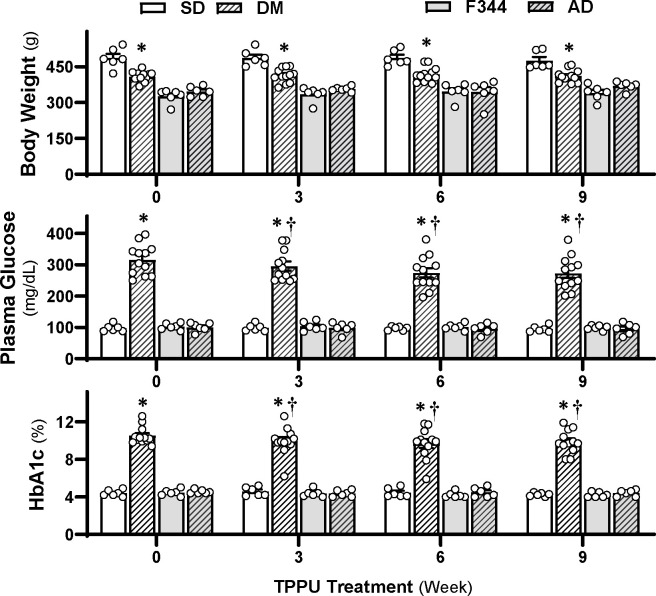
Figure 1. Impact of Chronic sEH Inhibition on Body Weight, Plasma Glucose, and Glycated Hemoglobin A1c (HbA1c) Levels in AD/ADRD Rats.
Comparison of body weight (upper panel), plasma glucose (middle panel), and HbA1c (lower panel) in age-matched diabetic T2DN (DM) vs. Sprague Dawley (SD) and TgF344-AD (AD) vs. F344 rats. These rats were treated with either a vehicle (1% PEG-400 in drinking water) or a sEH inhibitor TPPU (1 mg/kg/day) for 9 weeks. Mean values ± SEM are presented, with 6–12 rats per group. * denotes p < 0.05 from the corresponding values in AD or DM-ADRD rats compared to their respective control rats. † denotes p < 0.05 in corresponding values from TPPU-treated rats compared to untreated rats (week 0) within the same strain.

