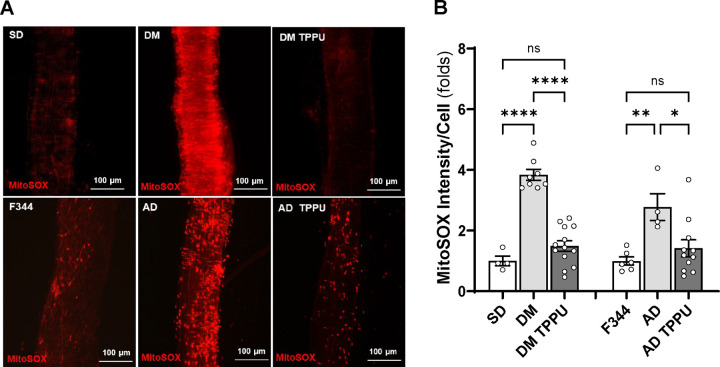
Figure 10. Impact of Chronic sEH Inhibition on the Production of Mitochondrial Superoxide in the MCA of AD and ADRD Rats.
A. Representative images of MitoSOX staining in MCA freshly isolated from age-matched diabetic T2DN (DM) vs. Sprague Dawley (SD) rats and TgF344-AD (AD) vs. F344 rats. The rats were treated with a vehicle (1% PEG-400 in drinking water) or the sEH inhibitor TPPU (1 mg/kg/day) for 9 weeks. B. Quantitative analysis of the fold change of MitoSOX fluorescence. Mean values ± SEM are presented, with 4 –13 rats per group. * denotes p < 0.05, ** denotes p < 0.01, and **** denotes p < 0.0001 for comparisons between the indicated values and their respective controls.

