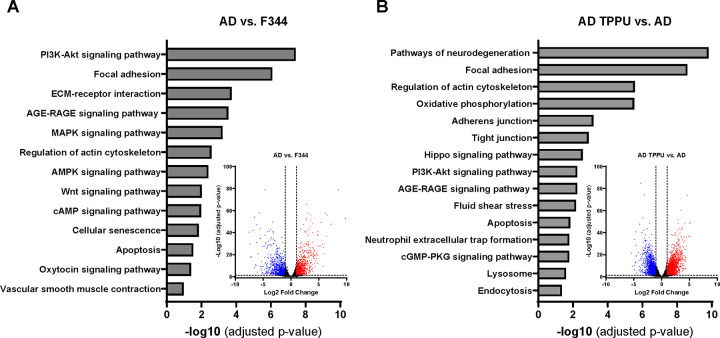
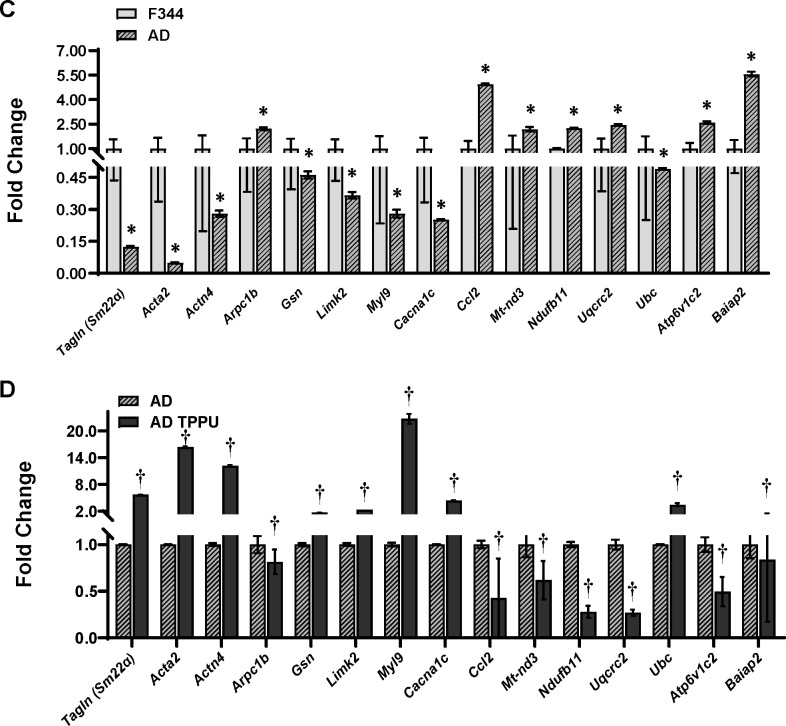
Figure 3. Comparison of Transcriptomic Profiling by Bulk RNA-seq in Primary Cerebral Vascular Smooth Muscle Cells (VSMCs) from TgF344-AD (AD) Rats Compared to F344 Control Rats.
A, B. KEGG pathway enrichment analysis of the top significantly altered pathways (FDR-adjusted p < 0.05). Volcano plots show differential gene expression between AD and control rats. The x-axis represents the log2 fold change in gene expression, and the y-axis represents the −log10 p-value. Genes with |log2FC| > 1 and an FDR-adjusted p-value < 0.05 (or q-value) are highlighted in red (upregulated) or blue (downregulated). C, D. Relative gene expression levels crucial for regulating cellular contraction, oxidative stress, and inflammation. * indicates p < 0.05 for comparisons between cells isolated from AD rats and F344 control rats. † indicates p < 0.05 for comparisons between TPPU-treated AD cells and vehicle-treated AD cells.


