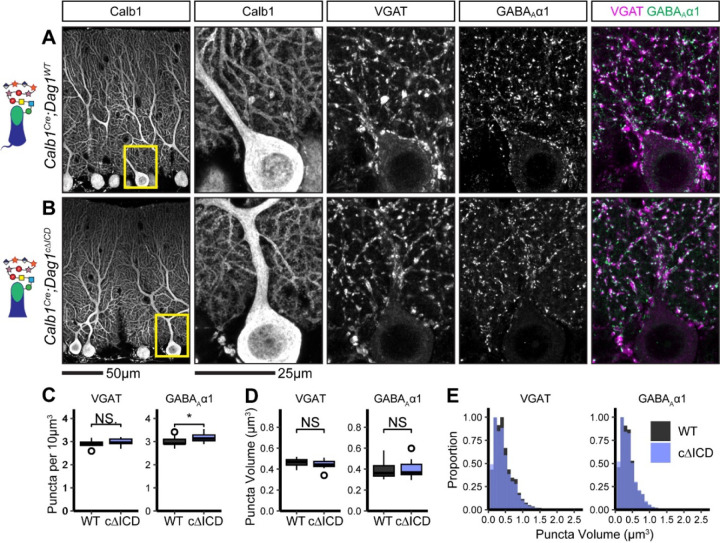
Figure 7. Inhibitory pre- and post-synaptic markers are relatively normal in Calb1Cre;Dag1cΔICD cerebellar cortex.
(A-B) Tissue sections from cerebellar vermis of Calb1Cre;Dag1cΔICDs (B) and littermate controls (A) was immunostained for Calbindin to visualize Purkinje cells along with the presynaptic marker VGAT (magenta) and postsynaptic GABAA receptor subunit GABAAα1 (green). The first panel shows a low-magnification view of the Calbindin channel. Subsequent panels are magnified views of the yellow outlined region in the first panel. Images are maximum projections. (C) Quantification of VGAT (left) and GABAAα1 (right) puncta density (per 10μm3). Open points indicate statistical outliers, however no datapoints were excluded from statistical analysis. (D) Quantification of VGAT (left) and GABAAα1 (right) puncta size (in μm3). (E) Quantification of the distribution of VGAT (left) and GABAAα1 (right) puncta sizes (in μm3), normalized to a maximum of 1. Calb1Cre;Dag1WT N = 13 images, 3 animals. Calb1Cre;Dag1cKO N = 13 images, 3 animals.

