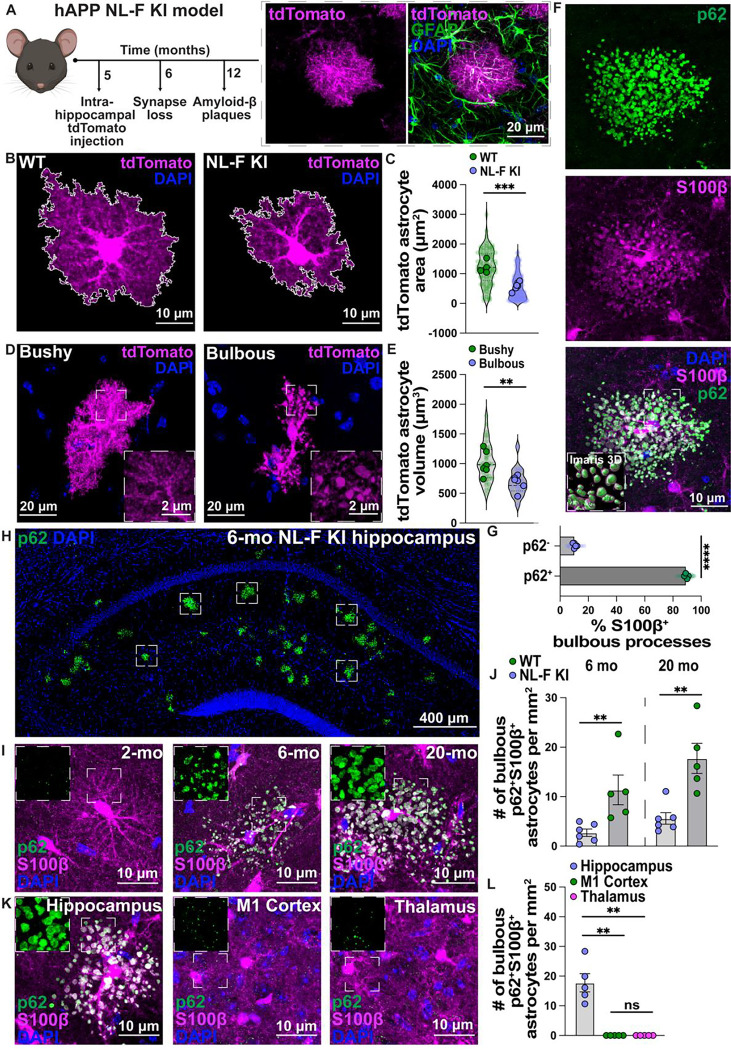
Fig 1. Identification of a unique p62-accumulated bulbous astrocyte subset in the NL-F KI hippocampus.
A) Schematic of NL-F KI mouse model and viral tdTomato labeling strategy to visualize complex hippocampal astrocyte processes. Immunostaining for GFAP (green) post intra-hippocampal AAV2/5-GfaABC1D-tdTomato (tdTomato) (magenta) injection. Scale bar = 10 μm. B) Representative images of tdTomato-labeled astrocytes (magenta) in the 6-mo WT and NL-F KI hippocampus. Scale bar = 10 μm. Images are modified on ImageJ as shown by white ROI. C) Quantification of the tdTomato labeled astrocyte area (μm2) using ImageJ. Transparent points = individual astrocytes (16–58 astrocytes per mouse; 104 WT and 183 NL-F KI astrocytes sampled in total); full points = mouse average of ROIs (n=4–6 male mice per genotype). Unpaired two-tailed student’s t-test on mouse average. D) Representative images of tdTomato-labeled (magenta) astrocytes in the 6-mo hippocampus showing a bushy and bulbous astrocyte. Scale bar = 20 μm. Insets show representative zoom-ins of processes. Scale bar = 2 μm. E) Quantification of the tdTomato-labeled astrocytic volume (μm3) using Imaris 3D surface rendering. Transparent points = individual astrocytes (5–7 astrocytes per condition; 35 NL-F KI bushy and 31 NL-F KI bulbous astrocytes sampled in total); full points = mouse average of ROIs (n=6 male mice). Paired two-tailed student’s t-test on mouse average. F) Representative image of p62 (green) and S100β (magenta) immunoreactivity in the hippocampus. Scale bar = 10 μm. Inset shows representative Imaris 3D reconstruction of p62 within the S100β+ astrocytic surface. G) Quantification of the % colocalization between p62 and S100β+ bulbous astrocytes in the hippocampus using ImageJ. Transparent points = individual astrocytes (3 astrocytes per mouse; 15 astrocytes sampled in total per condition), full points = mouse average of ROIs (n=5 male mice). Ratio paired two-tailed student’s t-test on mouse average. H) Representative image of p62 (green) immunoreactivity in the 6-mo NL-F KI hippocampus. Scale bar = 400 μm. Insets highlight some regions with bulbous astrocytes. I) Representative images of p62 (green) and S100β (magenta) immunoreactivity in the 2-, 6- and 20-mo hippocampus. Scale bar = 10 μm. Insets show representative zoom-ins of p62-immunostaining. J) Quantification of the number of p62+ S100β+ bulbous astrocytes per mm2 in the hippocampus in 6-mo (left) and 20-mo (right). Each point = 1 mouse (n=5–6 male mice). Two-tailed Mann-Whitney (6-mo) or unpaired two-tailed student’s t-test (20-mo) on mouse average. Dashed line represents graph split. K) Representative images of p62 (green) and S100β (magenta) immunoreactivity in the hippocampus, motor cortex (M1) and thalamus. Scale bar = 10 μm. Insets show representative zoom-ins of p62-immunostaining. L) Quantification of the number of p62+ S100β+ bulbous astrocytes per mm2 in hippocampus, motor cortex (M1) and thalamus. Each point = 1 mouse (n=5 male mice). Kruskal-Wallis test (p<0.001) followed by the Dunn’s multiple comparisons test on mouse average. All data shown as mean ± SEM. p-values shown ns P>0.05; *P<0.05; **P<0.01; ***P<0.001; ****P<0.0001.

