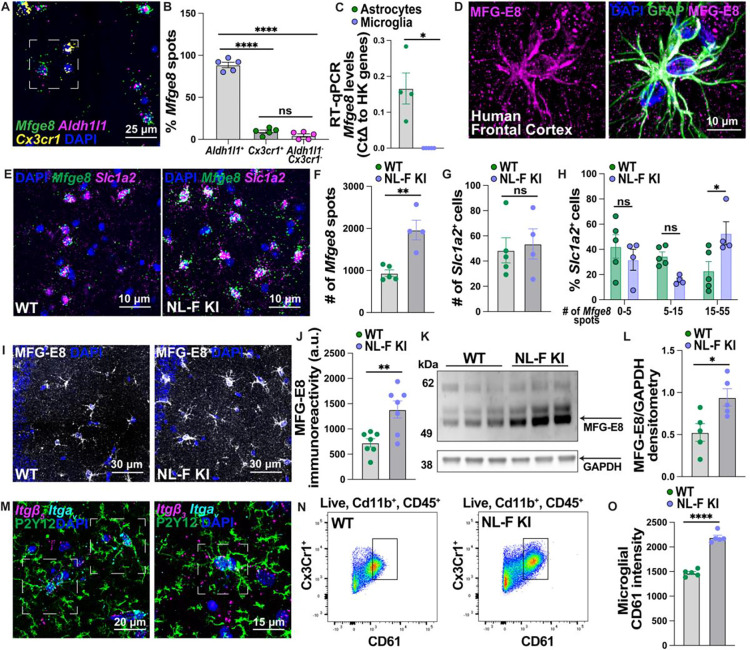
Fig 4. Increased astrocytic MFG-E8 signaling at the onset of synapse loss in the NL-F KI hippocampus.
A) Representative image of RNAScope probing for Mfge8 (green), Aldh1l1+ astrocytes (magenta) and Cx3cr1+ myeloid cells (yellow) in the hippocampus. Scale bar = 25 μm. Inset shows exemplary ROI. B) Quantification of the number of Mfge8 mRNA spots on Aldh1l1+ astrocytes, Cx3cr1+ myeloid cells or Aldh1l1−Cx3cr1− cells in the hippocampus using Imaris. Data shown as a percentage of the total number of Mfge8 spots in a large area of interest. Each point = 1 mouse (n=5 female mice). One-way ANOVA (F (2, 12) = 378.9, p<0.0001) followed by Bonferroni’s multiple comparisons post-hoc test on mouse average. C) RT-qPCR probing for Mfge8 expression in FACS sorted ACSA2+CD45− astrocytes and CX3CR1+CD45+CD11b+ microglia. Gene expression is normalized to the geomean of 3 house-keeping genes (Actb, Gapdh and Rpl32) by the Delta CT method. Each point = 1 mouse (n=3–4 female mice). Unpaired two-tailed student’s t-test with a Welch’s correction on mouse average. D) Representative images of MFG-E8 (magenta) and GFAP (green) immunoreactivity in the post-mortem human frontal cortex. Scale bar = 10 μm. E) RNAScope probing for Mfge8 (green) on Slc1a2+ (magenta) astrocytes in the 6-mo WT and NL-F KI hippocampus. Scale bar = 15 μm. F) Quantification of the total number of Mfge8 spots in a large region of interest using Imaris. Each point = 1 mouse (n=4–5 mixed male and female mice per genotype). Unpaired two-tailed student’s t-test on mouse average. G) Quantification of the number of Slc1a2+ astrocytes in a large region of interest using Imaris. Each point = 1 mouse (n=4–5 mixed male and female mice per genotype). Unpaired two-tailed student’s t-test on mouse average. H) Quantification of the number of Mfge8 mRNA spots in the hippocampus shown as percent distribution on Slc1a2+ astrocytic nuclei. Each point = mouse average (n=4–5 mixed male and female mice per genotype). Two-way ANOVA (Interaction: F (2, 21) = 6.188, p<0.01) followed by Bonferroni’s multiple comparisons post-hoc test on Y=log(Y) transformed mouse average. I) Representative images of MFG-E8 (white) immunoreactivity in the 6-mo hippocampal CA1 SR in WT and NL-F KI mice. Scale bar = 30 μm. J) Quantification of MFG-E8 immunoreactivity in large region using ImageJ. Each point = mouse average (n=7 male mice per genotype). Unpaired two-tailed student’s t-test on mouse average. K) Western blot probing for MFG-E8 (55–75 kDa) with respect to GAPDH loading control (39 kDa) in 6-mo WT and NL-F KI hippocampal homogenates. 1 lane is 1 mouse. L) Quantification of MFG-E8/GAPDH using ImageJ densitometry analysis. Each point = mouse average (n=5 male mice per genotype). Unpaired two-tailed student’s t-test on mouse average. M) Representative images of RNAScope followed by immunostaining probing for either Itgav (cyan) and Itgb5 (magenta) integrin mRNA subunits (left) or Itgav (cyan) and Itgb3 (magenta) integrin mRNA subunits (right) with microglial P2Y12 (green) in the hippocampus. Scale bar = 20 (left) and 15 (right) μm. Inset highlight ROIs. N) Flow cytometry probing for CD61 integrin on CD45+CD11b+CX3CR1+ hippocampal microglia from 6-mo WT and NL-F KI mice. O) Quantification of the levels of CD61 on CD45+CD11b+CX3CR1+ microglia. Each point = mouse average (n=5 female mice per genotype). Unpaired two-tailed student’s t-test followed by a Welch’s correction on mouse average. All data shown as mean ± SEM. p-values shown ns P>0.05; *P<0.05; **P<0.01; ***P<0.001; ****P<0.0001.

