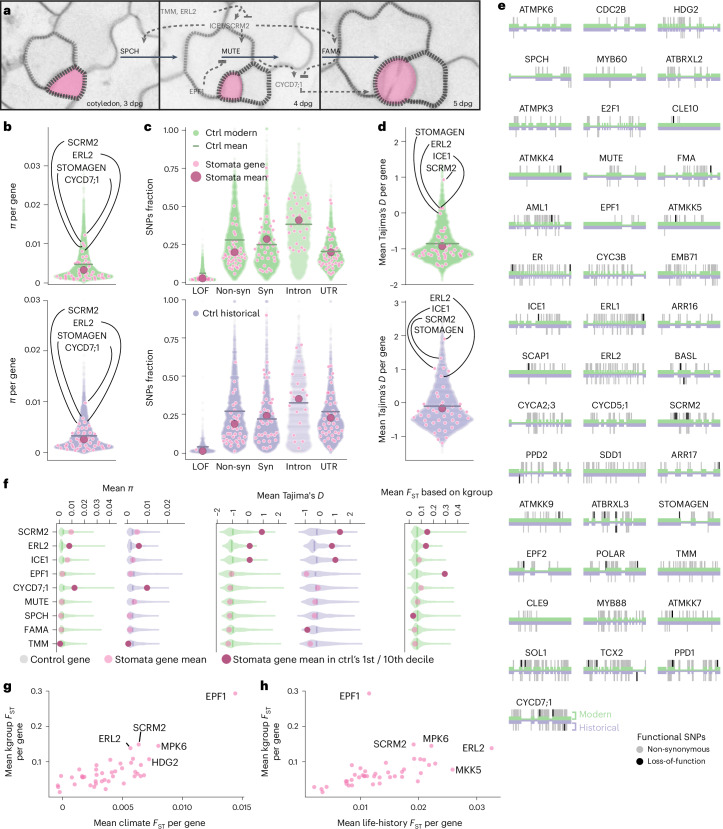
Fig. 1. Conserved core stomata genes and regulatory genes show local adaptation signals.
a, Stomatal development in A. thaliana (simplified, example regulators in grey, central (core) transcription factors in black. Stomata false-coloured in magenta. Cotyledons imaged at 3, 4 and 5 days post germination. b, Genetic diversity in stomatal genes is significantly lower than in length-matched control genes (gene names mark outliers; nucleotide diversity π per gene, empirical Pmod = 0.004, Phist = 0.046). c, Significantly fewer SNPS in stomatal genes are putative LOF or non-synonymous than in the control genes (empirical Pmodnon-syn = 0, Phistnon-syn = 0.002, PmodLOF = 0, PhistLOF = 0.047; Supplementary Table 3). Ctrl, control; Non-syn, non-synonymous. d, Mean per-gene Tajima’s D indicates selection signals. Stomatal gene group is not significantly different (Pmod, Phist > 0.1) from the control, but several genes are outliers (labelled). Significance tests for panels b–d asked whether means of the group of stomatal genes were outliers compared with the means of 1,000 control gene groups. Purple for historical, green for modern datasets, horizontal line indicates full control dataset’s mean. Magenta circles for stomatal genes, large dark circles for stomatal gene group mean. e, LOF (black) and non-synonymous (grey) SNPs in the 43 focus genes in historical (bottom, purple) and modern (top, green) dataset. f, Mean per-gene values for nucleotide diversity π, Tajima’s D and FSTkgroup values for outlier genes, compared with conserved stomatal factors SPCH, MUTE and FAMA (for all 43 genes, see Supplementary Figs. 2 and 3 and Supplementary Table 2). FSTkgroup is calculated for populations defined by whole-genome genetic variation (from ref. 49). Gene values are displayed as transparent pink circles on violin plots representing distribution of values for the respective length-matched control genes, vertical line indicating distribution’s 0.5 quantile. Solid pink circles indicate that the gene mean value lies within the 1st/10th decile of the control distribution. g,h, Stomatal gene differentiation as mean FST per gene, with FSTkgroup (y-axis), compared with FST for populations clustered by climate of origin (precipitation, temperature, BIO4 and BIO15, Bioclim dataset; ref. 50) (g) and life-history traits (data; ref. 51) (h). Genes with the highest FST values across the three analyses are labelled.

