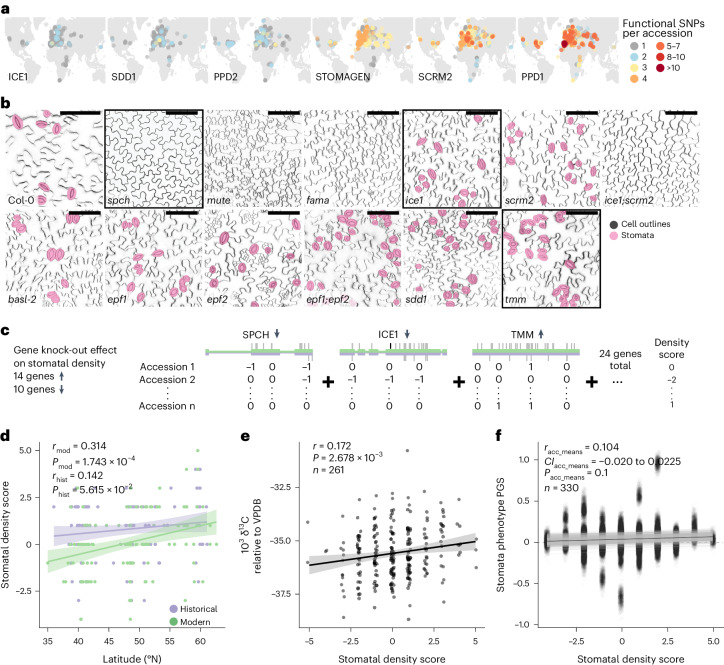
Fig. 2. Functional score predicts stomatal density patterns.
a, Geographic distribution of functional (non-synonymous, LOF) SNP accumulation in historical and modern samples for six genes with the overall highest amounts of putatively functional SNPs, overlaid on a continental map. Colour gradient from grey to dark red indicates samples with 1 to over 10 functional SNPs. b, Gradient of stomatal density differences resulting from loss of major stomatal development genes visualized with confocal microscopy. Stomata are false-coloured in magenta; scale bars, 100 µm. Black frames around three example genes used in c. c, Schematic overview detailing the generation of the experimentally informed stomatal density score. Of 24 genes with known effect on stomatal density, loss of 14 increases and loss of 10 decreases stomatal density. Putatively functional SNPs are assigned a ‘−1’ when located in genes whose loss decreases density and a ‘+1’ in genes whose loss increases density. Density scores for each historical and modern sample are calculated as the sum of these values across the 24 genes, counting a single functional SNP per gene. d, Linear regression (±s.d.) of the stomatal density score with paired samples’ latitude of origin, separated into historical (purple) and modern (green) samples (for each n = 126, one-sided Pearson’s correlation test Pmod = 1.743 × 10⁻⁴, Phist = 5.615 × 10⁻², correlation coefficient rmod = 0.314, rhist = 0.142). Analyses exclude samples from North America and the African continent. e, Correlation (±s.d.) of the density score with the δ13C measurement, a proxy of WUE, in 261 A. thaliana accessions. This is based on isotope amount ratios of stable carbon isotopes 13C/12C, expressed as ‰ against the Vienna Pee Dee Belemnite (VPDB; ref. 111) standard (one-sided Pearson’s correlation test P = 2.678 × 10⁻³, correlation coefficient r = 0.172; δ13C (stable carbon isotope ratio) data from ref. 16). f, Correlation (±s.d.) of the stomatal density score with genome-wide association-based traditional PGS for stomatal density (one-sided Pearson’s correlation test, positive correlation 997/1,000 re-trainings, 141/1,000 significant one-sided Pearson’s correlation tests with P < 0.05, correlation coefficient rmedian = 0.092; stomatal density data from ref. 16).

