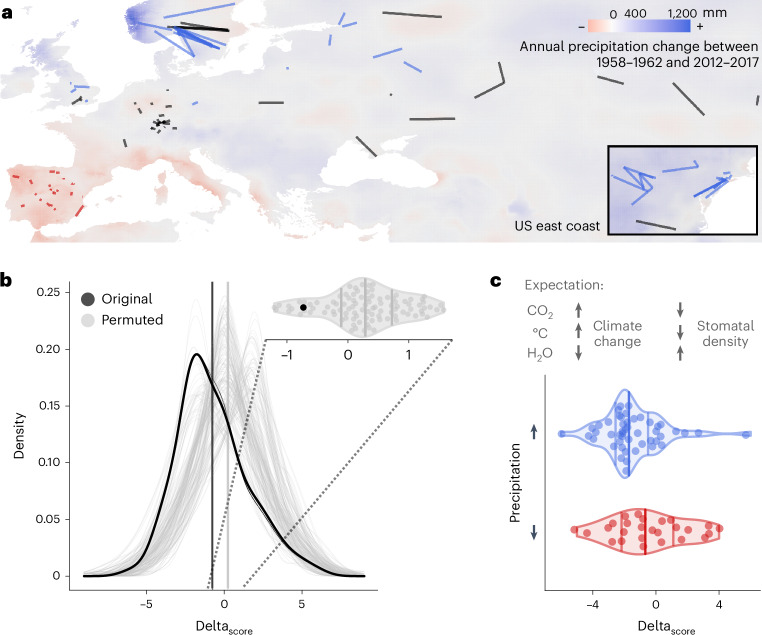
Fig. 3. Stomatal density decrease over time fits climate change expectations.
a, Map with historical and modern sample pairs as used for stomatal density change analyses (in b and c). Connecting lines between sample pairs are coloured by the precipitation change in the sample locations; red indicates a significant decrease in precipitation from 1958 to 2017 in both the historical and modern sample location, blue indicates a significant increase in precipitation, and black no significant change or different changes in paired locations. Background colour gradient indicates change in the mean annual precipitation between 1958–1962 and 2012–2017, with colours as above. Inlay shows sample pairs located on the North American East Coast. b, Distribution of per sample-pair calculated difference in stomatal density scores (deltascore = modern − historical) for original data (black) and 100 permutations (grey) between genes and their assigned effect (decrease/increase) on stomatal density, with genetic variation itself remaining un-permuted; mean deltascore = −0.730, Wilcoxon signed rank test, P < 2.2 × 10⁻¹⁶. Density distribution means are marked by solid black and grey vertical lines. Violin plot of the distribution means, with the non-permuted mean deltascore lower than 92/100 permutations. c, Expected effects of climate-change-related shifts in [CO2], temperature and water availability on stomatal density (based on published experiments, for example, refs. 17–20). Change in the stomatal density score (deltascore = modern − historical) in sample pairs with significantly increased (blue, n = 48) or decreased (red, n = 26) precipitation in geographic locations of origin (excluding sample pairs where precipitation did not change significantly or where a pair’s locations did not change in the same way). Horizontal lines indicate 0.25, 0.5 and 0.75 distribution quantiles. Increased, but not decreased, precipitation is significantly associated with decreased deltascore (linear regression, deltascore ≈ precipitationdirectionality, Pincr_precipitation = 0.024, Pdecr_precipitation = 0.889, Pmodel = 0.045; Supplementary Table 9). Analyses include samples from North America and exclude samples from the African continent as well as pairs between island and mainland samples.

