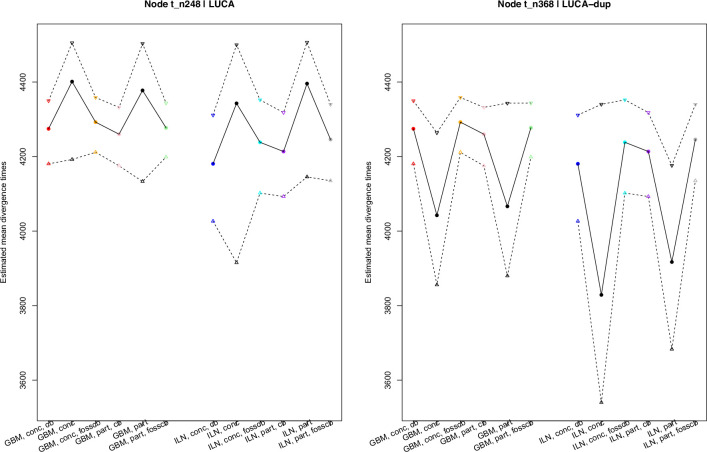
Extended Data Fig. 1. Comparison of the mean divergence times and confidence intervals estimated for the two duplicates of LUCA under each timetree inference analysis.
Black dots refer to estimated mean divergence times for analyses without cross-bracing, stars are used to identify those under cross-bracing and triangles for estimated upper and lower confidence intervals. Straight lines are used to link mean divergence time estimates across the various inference analyses we carried out, while dashed lines are used to link the estimated confidence intervals. The node label for the driver node is “248”, while it is “368” for the mirror node, as shown in the title of each graph. Coloured stars and triangles are used to identify which LUCA time estimates were inferred under the same cross-braced analysis for the driver-mirror nodes (that is, equal time and CI estimates). Black dots and triangles are used to identify those inferred when cross-bracing was not enabled (that is, different time and CI estimates). -Abbreviations. “GBM”: Geometric Brownian motion relaxed-clock model; “ILN”: Independent-rate log-normal relaxed-clock model; “conc, cb” dots/triangles: results under cross-bracing A when the concatenated dataset was analysed under GBM (red) and ILN (blue); “conc, fosscb”: results under cross-bracing B when the concatenated dataset was analysed under GBM (orange) and ILN (cyan); “part, cb” dots/triangles: results under cross-bracing A when the partitioned dataset was analysed under GBM (pink) and ILN (purple); “part, fosscb”: results under cross-bracing B when the concatenated dataset was analysed under GBM (light green) and ILN (grey); black dots and triangles: results when cross-bracing was not enabled for both concatenated and partitioned datasets.

