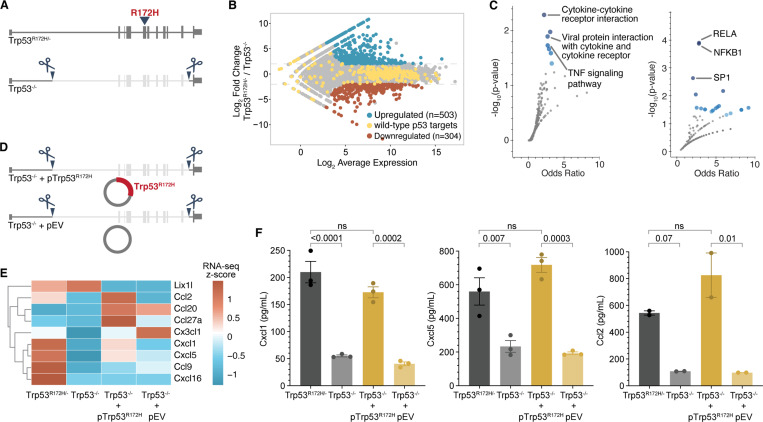
Figure 1. p53R172H elevates the expression of a subset of chemokine genes.
A, Generation of Trp53−/− isogenic cells from the parental Trp53R172H/− cells. Trp53 gene with R172H mutation in exon-5 is deleted from intron-1 to intron-10 using CRISPR/Cas9.
B, Minus-average (MA) plot of RNA-seq transcripts showing the differentially expressed genes between Trp53R172H/− and Trp53−/− isogenic cells. Significantly upregulated and downregulated genes (adjusted p-value < 0.001 and four-fold change in normalized counts) are shown in blue and red, respectively. The wild-type p53-regulated genes are shown in yellow.
C, Pathways (left) and transcription factor targets (right) enriched in p53R172H-upregulated genes. Gene Ontology analysis was performed using Enrichr101 against the KEGG pathway database102 (left) and TRRUST database103 (right). Blue dots represent significant gene sets (p-value < 0.05), and the darker color represents higher significance.
D, Generation of Trp53R172H-restored isogenic cells in Trp53−/− cells using a Trp53R172H cDNA expression cassette in piggyback vector (Trp53−/− + pTrp53R172H). An empty vector without the Trp53R172H cDNA expression cassette (Trp53−/− + pEV) was inserted in Trp53−/− as a control.
E, mRNA levels of the expressed chemokine genes are shown as the z-score heatmap of RNA-seq transcripts per million (TPM) in the four isogenic cells.
F, Quantification of the three chemokine genes under p53R172H control by ELISA in the tissue culture media of the four isogenic cells. P-values are calculated from a one-way ANOVA test followed by a post hoc test with Benjamini-Hochberg correction. Panels B, C, E, and F use Trp53−/− clone-1 isogenic cells.

