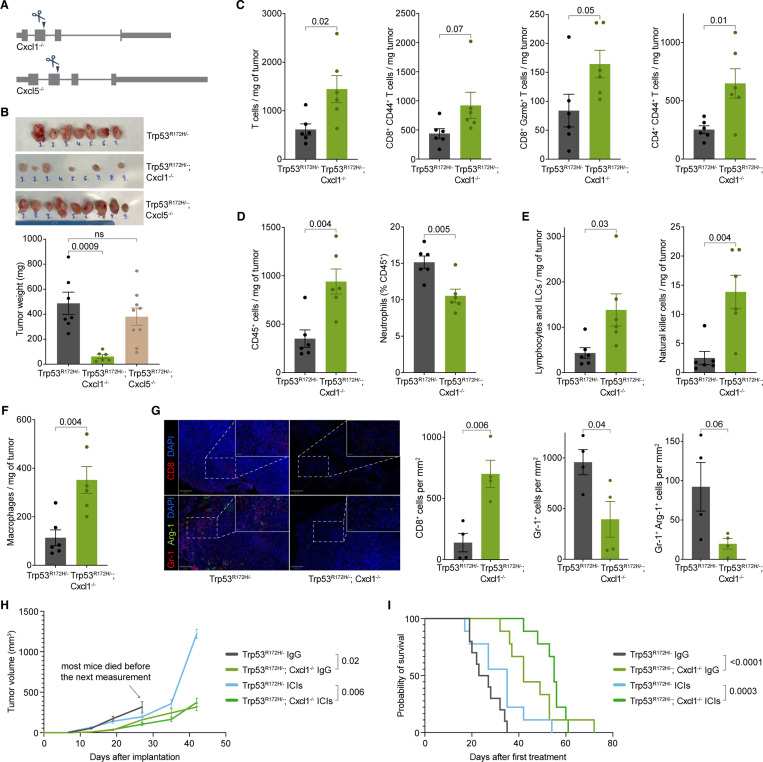
Figure 3. Cxcl1 mediates the immunosuppressive role of p53R172H and abrogates ICIs efficacy.
A, Generation of Trp53R172H/−;Cxcl1−/− and Trp53R172H/−;Cxcl5−/− isogenic cells from the parental Trp53R172H/− cells. A single guide-RNA-mediated genome editing using CRISPR/Cas9 resulted in a frameshift mutation.
B, Weights of the Trp53R172H/−;Cxcl1−/− and Trp53R172H/−;Cxcl5−/− tumors compared with the Trp53R172H/− tumors. P-values are calculated from a one-way ANOVA test followed by a post hoc test with Benjamini-Hochberg correction.
C, Effect of the Cxcl1 status in T cell infiltration in PDAC tumors. P-values are calculated using a two-tailed t-test.
D, Effect of the Cxcl1 status in leukocyte (CD45+) and neutrophil (CD45+CD11b+MHCII-Ly-6G+) infiltration in PDAC tumors. P-values are calculated using a two-tailed t-test.
E, Effect of the Cxcl1 status in lymphocyte (CD45+CD11b-CD90+NK1.1-) and NK cell (CD45+CD11b-CD90+NK1.1+) infiltration in PDAC tumors. P-values are calculated using a two-tailed t-test.
F, Effect of the Cxcl1 status in macrophage (CD45+CD11b+CD64+) infiltration in PDAC tumors. P-values are calculated using a two-tailed t-test.
G, Representative multiplex immunofluorescence staining of Trp53R172H/− and Trp53R172H/−;Cxcl1−/− tumors (left), and quantification of immune cells density from randomly selected 500 × 500 μm regions (right). The scale bars correspond to 200 μm and 50 μm in the main view and the magnified view, respectively. P-values are calculated using a two-tailed t-test.
H, Effect of the Cxcl1 status and ICIs in PDAC tumor growth. Control mice were treated with IgG. Trp53R172H/− tumor growth cohort is the same as in Figure S4C. Tumor volumes from the last measurement with at least three mice left in the cohort were used to calculate p-values using a two-tailed t-test.
I, Kaplan-Meier survival curves showing the effect of Cxcl1 status and ICIs in the survival of mice implanted with parental Trp53R172H/− or Trp53R172H/−;Cxcl1−/− cells. Control mice were treated with IgG. Trp53R172H/− mice survival cohort is the same as in Figure S4D. P-values are calculated using a log-rank (Mantel-Cox) test.

