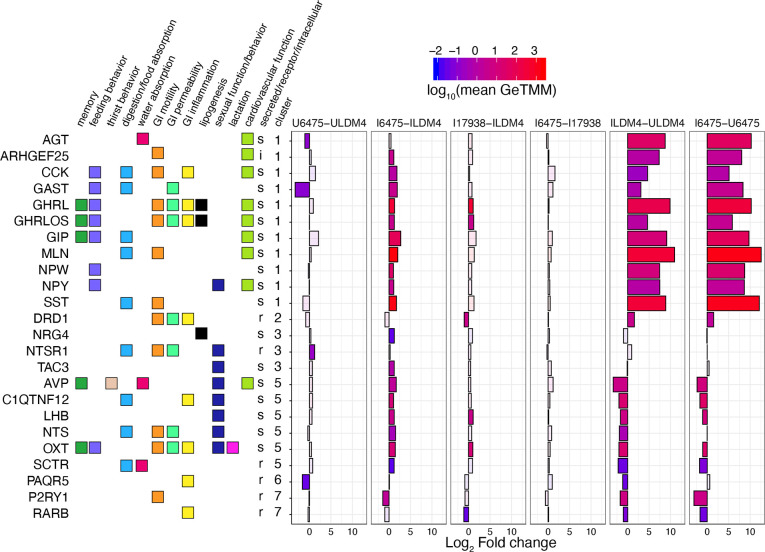
Figure 2:
Hormone genes differentially expressed by L. reuteri. DEGs annotated as having hormonal function are shown. The genes are annotated with their function, whether they are secreted, a receptor, or intercellular, and what cluster they belong to as in Supplemental Figure S4. The graph shows the log2 fold change expression of the gene for the indicated comparison. The bars are colored using the log10 scaled mean GeTMM counts to illustrate how abundantly expressed the gene is. Transparent overlays are used on genes not differentially expressed for the given comparison. Comparisons shown: U6475-ULDM4, L. reuteri 6475 on uninduced HIOs compared to LDM4 media control; I6475-ILDM4, L. reuteri 6475 on induced HIOs compared to LDM4 media control; I17938-ILDM4, L. reuteri 17938 on induced HIOs compared to LDM4 media control; I6475-I17938 L. reuteri 6475 compared to L. reuteri 17938 on induced HIOs; ILDM4-ULDM4, LDM4 media control on induced versus uninduced HIOs; I6475-U6475, L. reuteri 6475 on induced versus uninduced HIOs. For each, positive fold changes indicate genes upregulated by the condition listed first.

