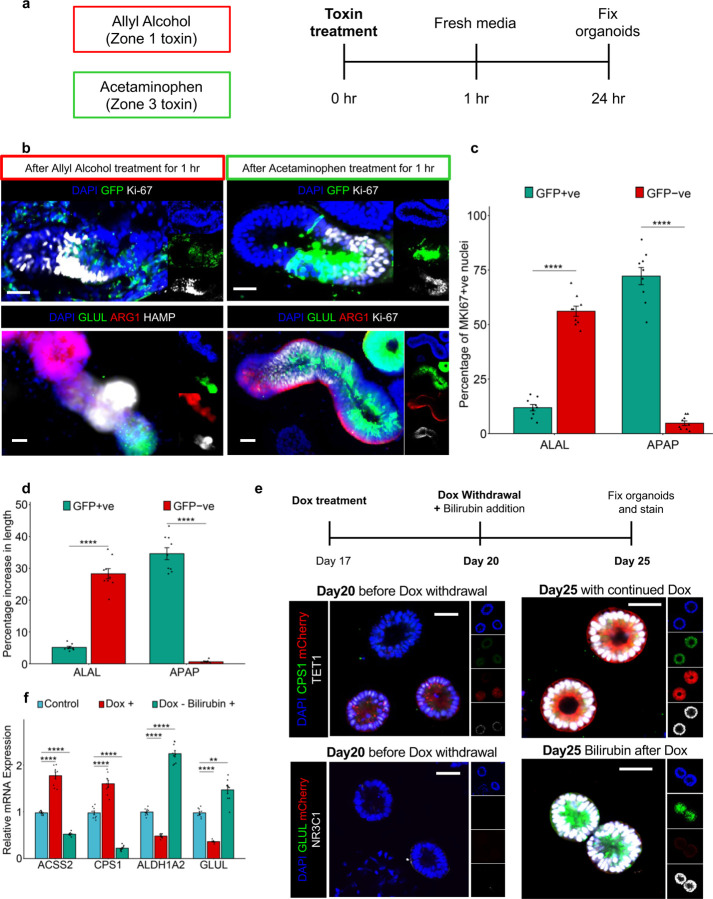
Extended Data Fig. 11. mZ-HLOs exhibit zone specific regenerative potential in response to toxins.
a) Experimental timeline for testing zonal regenerative potential of mZ-HLOs in response to zone specific toxins.
b) Immunofluorescence images of mZ-HLOs for proliferative marker Ki-67, GLUL, ARG1 and HAMP in response to Allyl Alcohol (Zone 1 toxin, left). Immunofluorescence images of mZ-HLOs for proliferative marker Ki-67, GLUL and ARG1 in response to Acetaminophen (Zone 3 toxin). Scale bar indicates 200 µm.
c) Comparison of Ki-67 + nuclei in different fluorescent regions in response to zone specific toxins. (n = 9 independent experiments)
d) Comparison of length of different fluorescent regions in response to zone specific toxins. (n = 9 independent experiments)
e) Immunofluorescence images of CPS1, TET1, GLUL, NR3C1, and mCherry in Z1-HLOs with Dox treatment and after Dox withdrawal and persistent bilirubin treatment at Day 20 and 25. Scale bar indicates 200 µm.
f) RT-qPCR of ACSS2, CPS1, ALDH1A2 and GLUL gene for Z3-HLOs with Dox (Dox +) and with bilirubin after Dox withdrawal (Dox – Bilirubin +) compared to control HLOs (Data is mean ± SD, n = 9 independent experiments).

