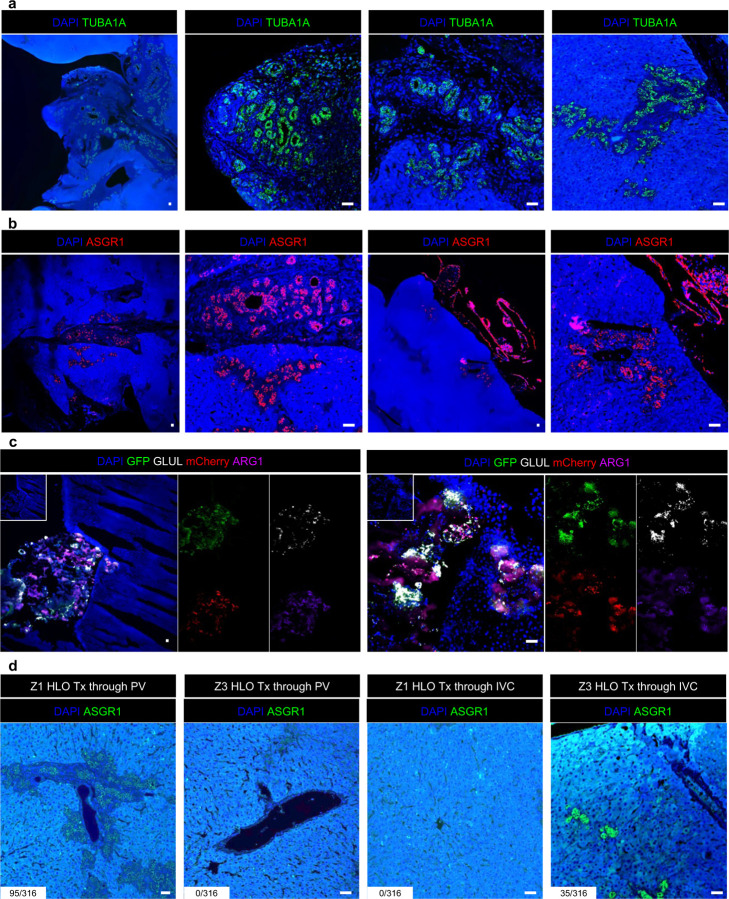
Extended Data Fig. 12. mZ-HLOs invade into the liver parenchyma of RRG rats after transplantation.
a) Immunofluorescence images for human TUBA1A of mZ-HLOs transplanted in RRG rat liver. Scale bar indicates 200 µm.
b) Immunofluorescence images for human ASGR1 of mZ-HLOs transplanted in RRG rat liver. Scale bar indicates 200 µm.
c) Immunofluorescence images for GFP, mCherry, human ARG1 and GLUL of mZ-HLOs transplanted in RRG rat liver. Scale bar indicates 200 µm.
d) Immunofluorescence images for human ASGR1 of Z1 and Z3-HLOs transplanted in RRG rat liver through the portal vein and inferior vena cava. Scale bar indicates 200 µm. Numbers indicate the ratio of the area of integrated organoids and total area of the liver parenchyma in view in 103 pixel2.

