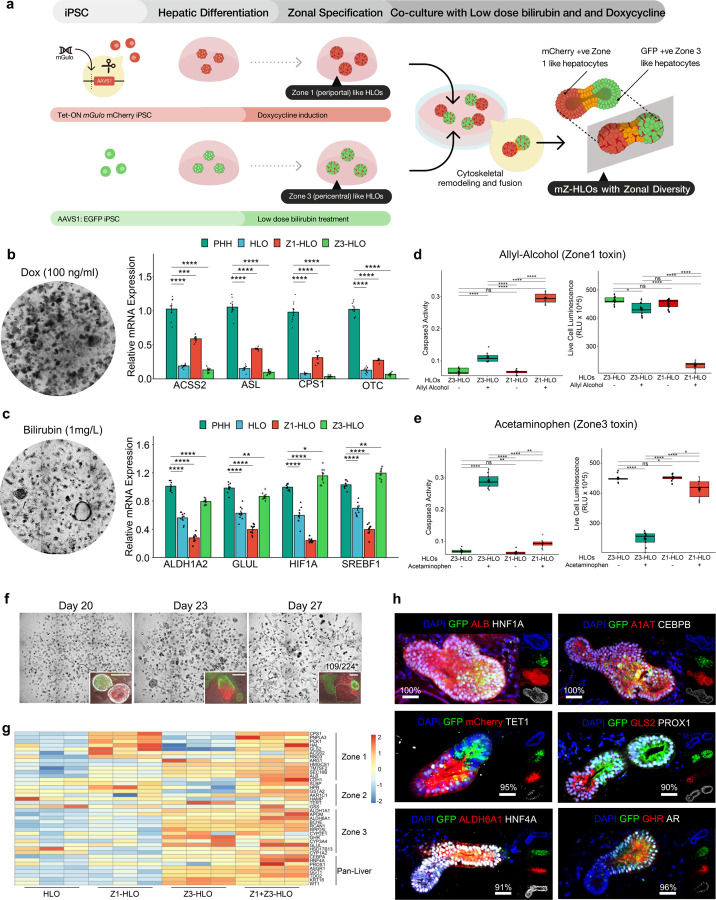
Fig. 1 |. Engineering PSC-derived human liver organoids with multizonal hepatocyte features.
a,Schematic for development of mZ-HLOs from doxycycline induced Z1-HLOs and low dose bilirubin treated Z3-HLOs. b,Brightfield images of Dox (100 ng/ml) treated Z1-HLOs (left). RT-qPCR of ACSS2, ASL, CPS1 and OTC gene for Z1-HLOs compared to Primary Human Hepatocytes (PHH), Z3- and control HLOs (right). (Data is mean ± SD, n = 9 independent experiments). c,Brightfield image of Z3-HLOs treated with low dose bilirubin (1mg/L) (left). RT-qPCR of ALDH1A2, GLUL, HIF1A and SREBF1 gene for Z3-HLOs compared to PHH, Z1- and control HLOs (right). (Data is mean ± SD, n = 9 independent experiments). d, Caspase 3 activity assay in Z3-HLOs compared to Z1-HLOs after treatment with Zone 1 toxin, Allyl alcohol, compared to control (left). Cell viability assay in Z3-HLOs compared to Z1-HLOs after treatment with Zone 1 toxin, Allyl alcohol, compared to control (right). (n = 9 independent experiments). e,Caspase 3 activity assay in Z3-HLOs compared to Z1-HLOs after treatment with Zone 3 toxin, Acetaminophen, compared to control (left). Cell viability assay in Z3-HLOs compared to Z1-HLOs after treatment with Zone 3 toxin, Acetaminophen, compared to control (right). (n = 9 independent experiments). f, Brightfield images (top) of progression of bilirubin induced fusion from Day 1 to Day 7. Fluorescent images of progression of organoid fusion from day 1 to day 7 when GFP+ Z3-HLOs were co-cultured with dox treated mCherry+ Z1-HLOs (inset). Scale bar indicates 200 µm. Numbers on the bar indicate the ratio of correctly fused organoids and total number of organoids. g, Heatmap of fused organoid compared to Z1-, Z3-, and control HLOs depicting expression of all zonal genes in the fused organoids. h, Immunofluorescence images of mZ-HLOs for pan liver markers: ALB, HNF4A, PROX1, HNF1A, A1AT, and CEBPB; Zone 1 markers: mCherry, TET1, and GLS2; Zone 3 markers: GHR, AR, and ALDH6A1. Scale bar indicates 200 µm. Numbers on the bar indicate the percentage of fused organoids that express dual and single positivity for the indicated antigen staining.

