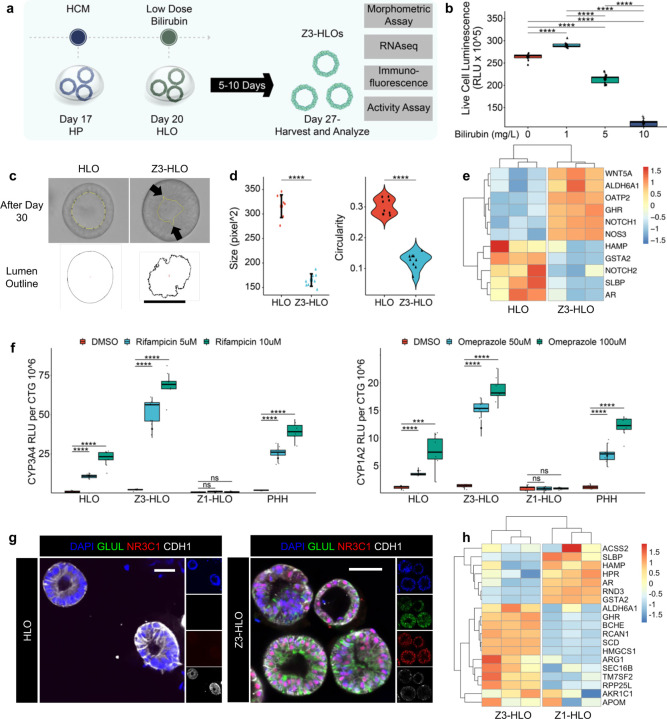
Extended Data Fig. 2. Low dose bilirubin promotes GLUL+ hepatocyte specification in HLOs.
a) Schematic for low dose bilirubin treatment and Z3-HLO development to induce GLUL+ expression.
b) Cell viability assay with different concentration of bilirubin to titrate dose for maximal viability. (n = 9 independent experiments).
c) Brightfield image of Z3-HLOs treated with low dose bilirubin (1mg/L) compared to control, and luminal outline using ImageJ, arrows indicate luminal projections that are similar to bile canaliculi found in human liver. Scale bar indicates 200 µm.
d) Comparison of size and circularity of lumen of the control and 1 mg/L bilirubin treated Z3-HLOs. (n = 9 independent experiments)
e) Heatmap of Zone 3 genes from RNAseq dataset for bilirubin treated Z3-HLOs compared to control.
f) CYP3A4 activity assay in response to Rifampicin in control, Z1-, Z3-HLOs, and PHH (left). CYP1A2 activity assay in response to Omeprazole in control, Z1-, Z3-HLOs, and PHH (right). (n = 9 independent experiments).
g) Immunofluorescence images of Z3-HLOs for GLUL, NR3C1 and CDH1 compared to control HLOs. Scale bar indicates 200 µm.
h) Heatmap of Z1- and Z3-HLOs depicting expression of zonal genes and lack of consensus expression of markers such as ARG1 and AKR1C1.

