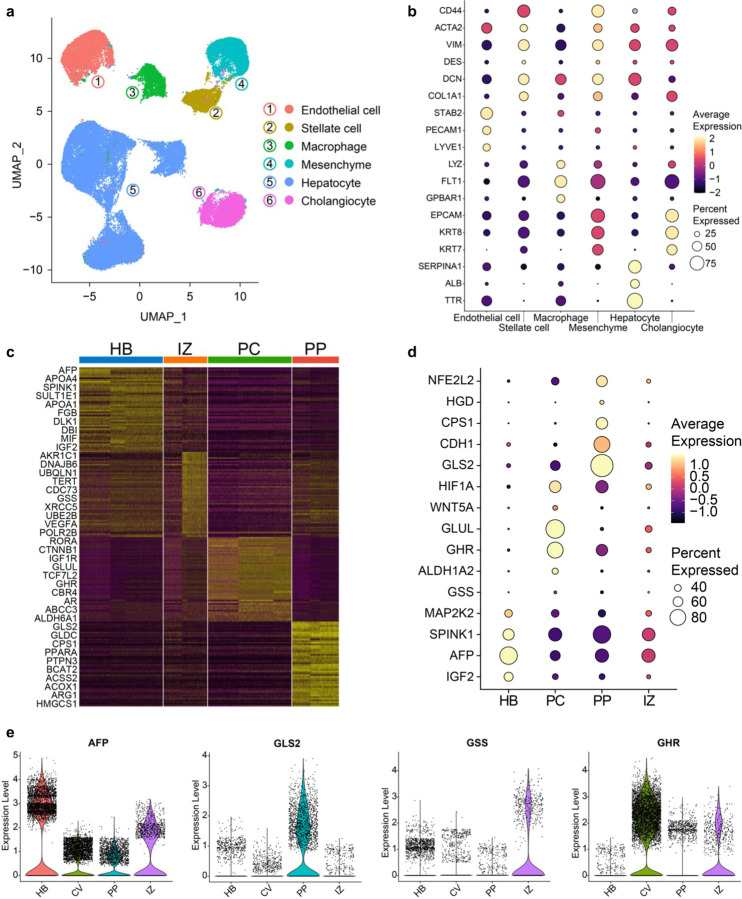
Extended Data Fig. 5. Single cell profiling of mZ-HLOs indicate the emergence of zonal like populations.
a) UMAP plot with the major populations (hepatocytes, cholangiocytes, endothelial cells, macrophages, stellate cells, and mesenchyme) of all nuclei in mZ-HLOs.
b) Distinct expression profile all populations in mZ-HLOs. The size of the circle indicates the percentage of nuclei in each population expressing each gene. The color represents the average expression level for the indicated gene.
c) Heatmap showing scaled mean expression of all genes in each cluster. Top 10 marker genes in each cluster have been added as labels.
d) Expression of known hepatoblast and zonal hepatocyte marker genes in each population.
e) Violin plot for expression of AFP (hepatoblast gene), GSS (interzonal hepatocytes), GHR (pericentral hepatocyte), and GLS2 (periportal hepatocyte).

