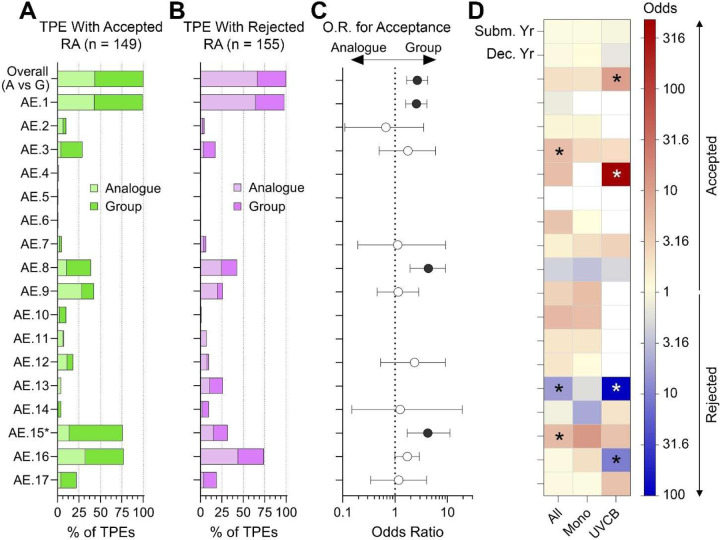
Figure 7.
Analysis of the publicly available TPE decisions by assessment elements (AEs). (A-B) Stacked bar plots show the number of substances Overall and for each AE, separated into TPEs that were Accepted (A), and Rejected (B). For AE15 (marked with *), the fractions shown is for UVCB substances only. (C) For the Overall data and for each AE, odd ratios (OR) and 95% confidence intervals for Acceptance in Group vs. Analogue (i.e. an OR>1.0 corresponds to greater odds of Acceptance for Group). The intervals for Overall, AE 1, AE 8, and AE 15 do not contain the null OR=1.0, corresponding to a significantly greater odds of Acceptance for Group (p<0.05). (D) ORs from multiple logistic regression analyses with predictors submission year, decision year, group vs. analogue-based RA, and all AEs. For each column (all TPEs, Mono and UVCB), the ORs are displayed on a color scale, where red indicates predictor increases the chance of Acceptance, blue indicates predictor decreases chance of Acceptance, and ‘*’ denotes coefficients that have false discovery rates of q<0.05.

