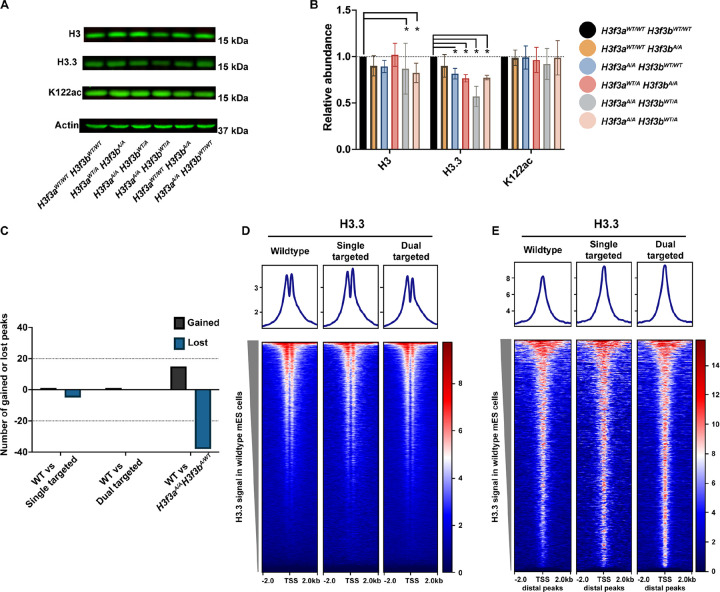
Figure 3: H3.3K122A cell lines have reduced H3.3 protein levels relative to wildtype cells but not reduced H3.3 chromatin occupancy.
A. Western blotting for total H3, H3.3, and K122ac in wildtype and H3.3K122A cell lines. Actin is used as a loading control.
B. Quantification of three biological replicates for each Western blot in A. Each dot represents a single biological replicate. *=P value ≤0.05, two sided T-test.
C. Differentially enriched H3.3 CUT&RUN peaks (|LFC|≥0.5 and FDR≤0.05) in the single targeted and dual targeted cell lines relative to wildtype. Black indicates number of upregulated peaks, and blue indicates number of downregulated peaks.
D. Metaplots and heatmaps visualizing average H3.3 enrichment over TSSs in wildtype, single targeted, and dual targeted cell lines. N=22,598 loci.
E. As in F, for gene distal H3.3 peaks. N=3,347 peaks.

