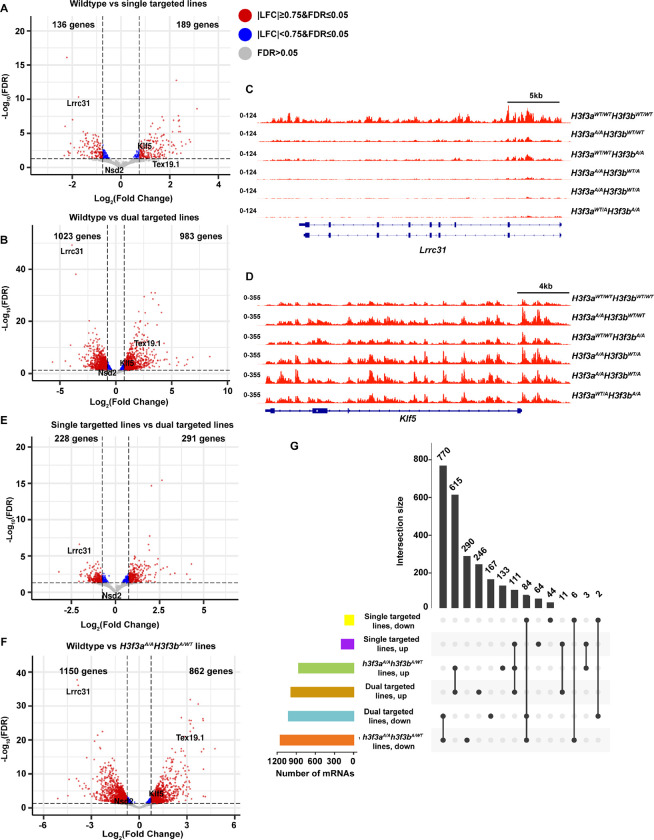
Figure 4: H3.3K122A results in transcriptomic changes in ES cells.
A. Volcano plot of differentially transcribed genes in single targeted H3.3K122A cells (H3f3aA/AH3f3bWT/WT and H3f3aWT/WTH3f3bA/A) relative to wildtype. Red points are genes |LFC|≥0.75 and FDR≤0.05, blue points are genes |LFC|<0.75 and FDR≤0.05, and grey points are not significantly changed.
B. As in A, for dual targeted lines (H3f3aA/AH3f3bA/WT and H3f3aA/WTH3f3bA/A) relative to wildtype.
C. Browser track of nascent RNA-seq (TT-seq) from H3.3K122A cell lines and wildtype cells over the Lrrc31 locus.
D. As in E, for the Klf5 locus.
E. As in A, for dual targeted relative to single targeted cell lines.
F. As in A, for H3f3aA/AH3f3bA/WT lines relative to wildtype.
G. Upset plot showing the number of differentially transcribed genes (log2(FC)≥0.75 and FDR≤0.05) shared between set of groups (upper bar graph) and the overall number of differentially transcribed genes in each group (lower left bar graph).

