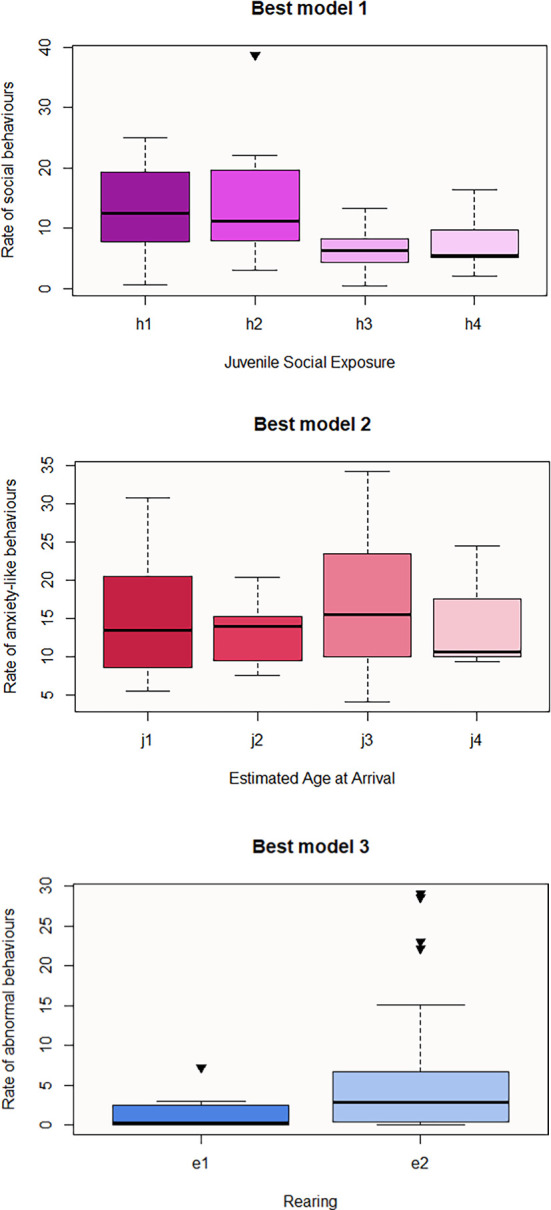
Figures 1-3. Boxplots representing the influence of background on observed behaviours.

Influence of Juvenile Social Exposure on the rate of social behaviours (Best model 1), influence of Estimated Age at Arrival on the rate of anxiety-like behaviours (Best model 2), and influence of Rearing on the rate of abnormal behaviours (Best model 3). Black inverse triangles represent outliers. For definition of the codes see Table 2.
