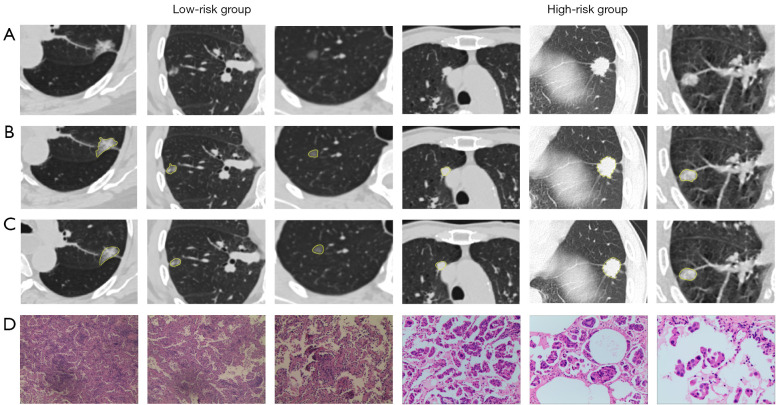
Figure 5.
The performance of auto-segmentation deep learning model; the sections were stained as hematoxylin-eosin staining in 5× magnification (low-risk group D) and 10× magnification (high-risk group D). (A) The original CT scan of the nodules; (B) the CT segmentation by radiologists; (C) the CT segmentation by deep learning algorithm; (D) the corresponding pathological performance of the CT scan. CT, computed tomography.

