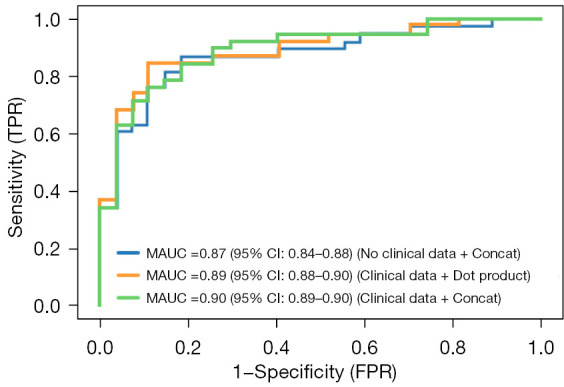
Figure 8.

Performance of the deep learning algorithm for classifying high- and low-risk lung adenocarcinoma based on CT and EMR data in test set of cohort 1. MAUC, mean area under the curve; CI, confidence interval; TPR, true positive rate; FPR, false positive rate; CT, computed tomography; EMR, electronic medical records.
