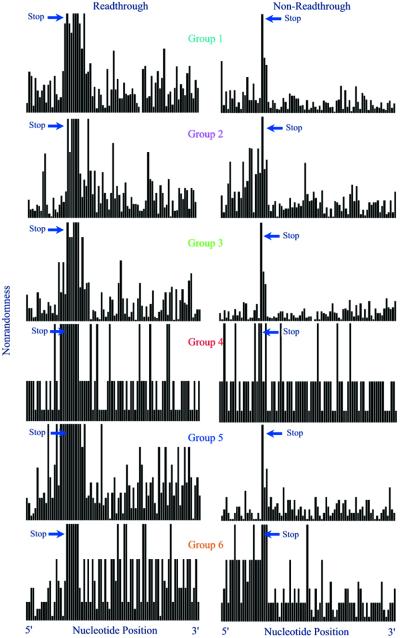
Figure 1.
Examination of non-randomness in read-through groups. Each data set represents the 82 nt region surrounding either the leaky (left column) or non-leaky (right column) stop codon for each of the six +1 triplet groups. For each data set, the x-axis represents the individual nucleotide position from the –19th to the +60th relative to the stop codon, and the y-axis is a measure of the non-randomness associated with each nucleotide position in the form of a c2 value.

