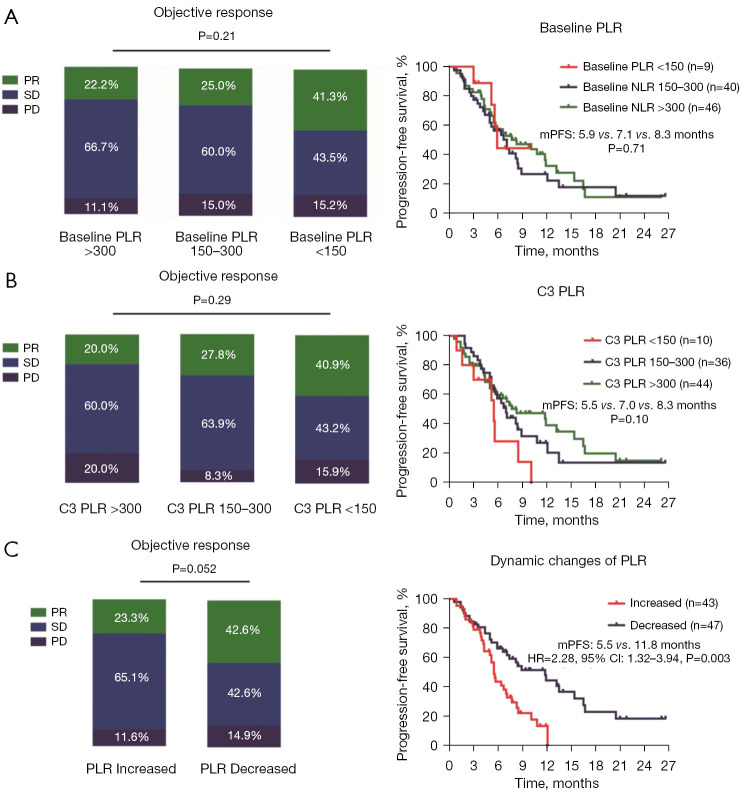
Figure 3.
Association between the PLR and clinical outcomes. (A) Association between the baseline PLR value and response rate; association between the baseline PLR value and median PFS. (B) Association between the C3 PLR value and clinical outcomes. (C) Association between the dynamic changes in the PLR value and clinical outcomes. PR, partial response; SD, stable disease; PD, progressive disease; PLR, platelet-to-lymphocyte ratio; mPFS, median progression-free survival; HR, hazard ratio; CI, confidence interval; C3, cycle 3.

