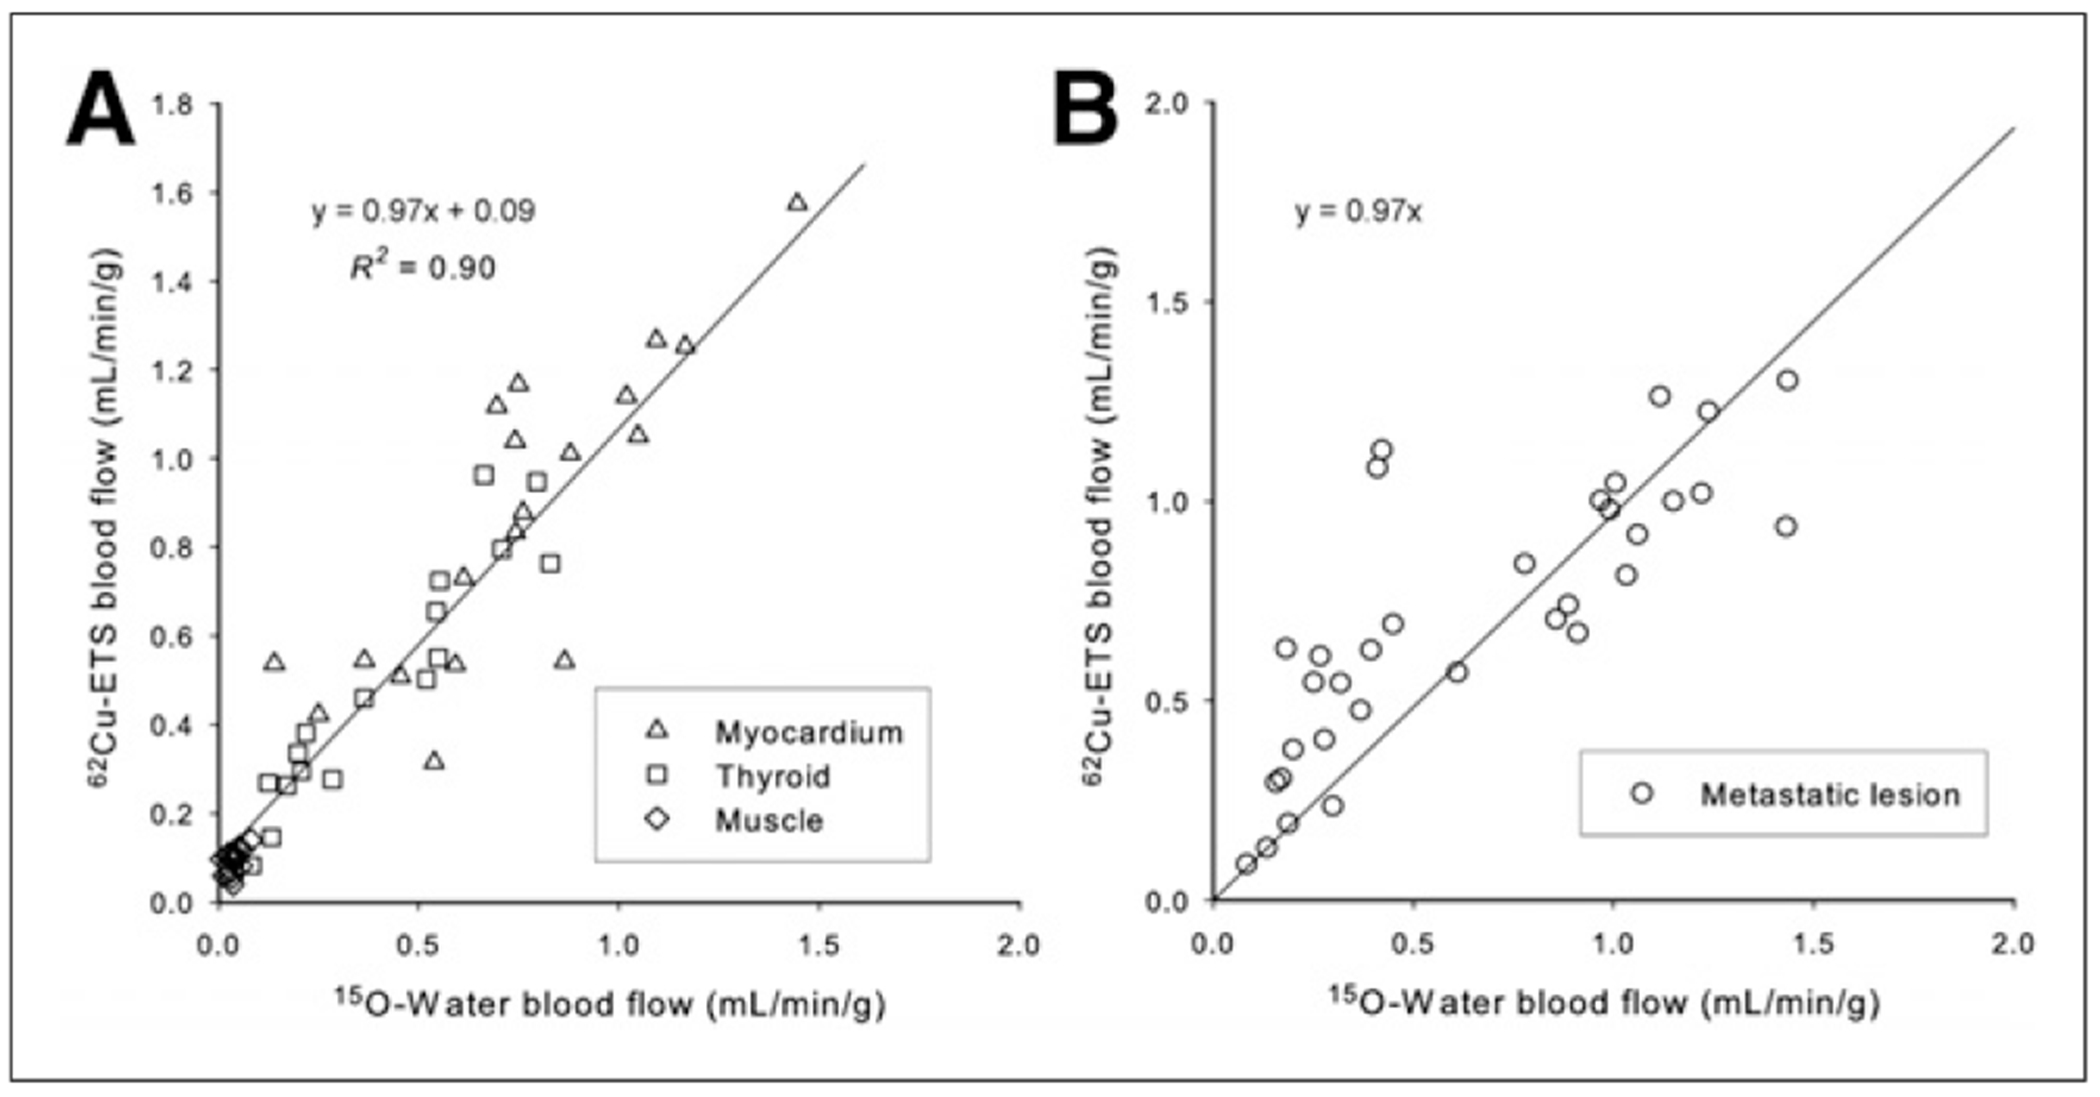
FIGURE 5.

Correlation of perfusion rate measurements (K1 values, mL·min−1·g−1) obtained with 62Cu-ETS and 15O-water when analyses are restricted to tissue regions from normal tissues alone (A, n = 53) and metastases alone (B, n = 35) in the 18 paired dynamic PET studies. For metastatic lesion data, regression line shown was forced through origin, illustrating that several lower flow lesions (all in lung) are largest source of variance. Unforced regression line for 5B is y = 0.70x + 0.27; R2 = 0.72.
