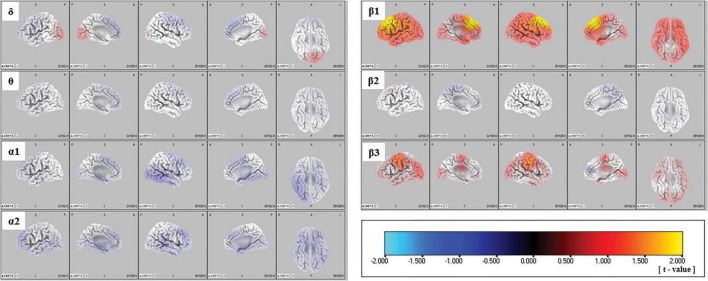
FIGURE 1.
Comparison of source imaging in the ARMS-P and -NP groups, as revealed by SnPM voxel-wise sLORETA comparisons of independent samples. Negative (i.e., lower in ARMS-P group) to positive (i.e., higher in ARMS-P group) t-values are represented by cyan-blue-black-red-yellow. ARMS-NP, at-risk mental state non-psychosis; ARMS-P, at-risk mental state psychosis; sLORETA, standardized low-resolution brain electromagnetic tomography; SnPM, statistical non-parametric mapping.

