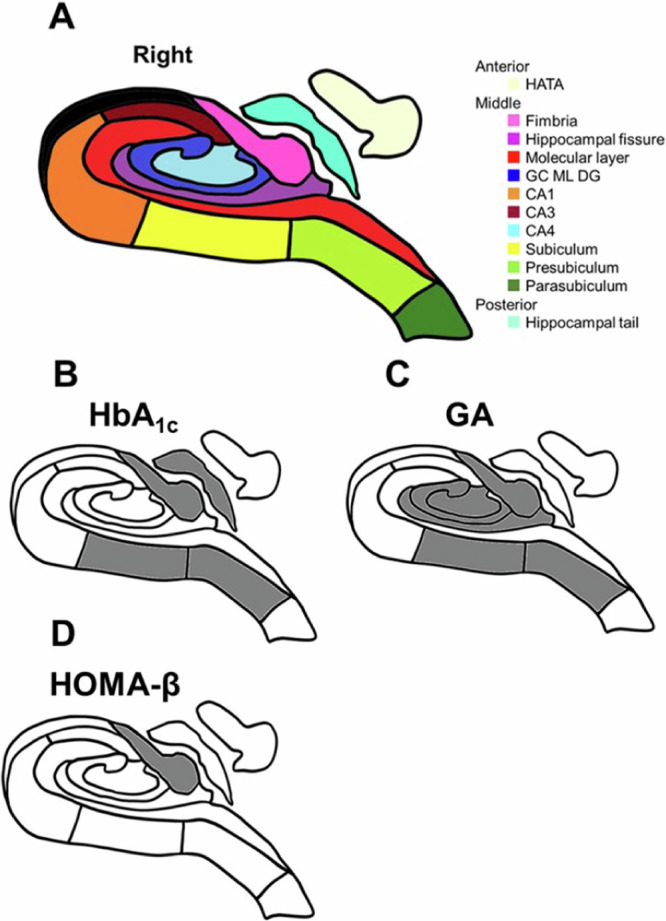
Fig. 2. Hippocampal subfields and the relationships between hippocampal subfields and glycemic measures or insulin secretion.

A A schematic representation of the right hippocampus in a coronal section. Hippocampal subfields are represented in different colors. HATA Hippocampus-amygdala-transition-area, GC, DG, ML, Granule cell and molecular cell layer of the dentate gyrus, CA Cornu Ammonis. Notice that the subfield HATA is transposed from an anterior coronal section, while the tail is transposed from a posterior coronal section. B–D A schematic representation displaying the substantial associations between hippocampal subregions and glycemic measures or insulin secretion measures in the analysis of the multivariable-adjusted values (Model 2): HbA1c (B), GA (C), and HOMA-β value (D). Gray color represents a substantially smaller volume in the subfields.
