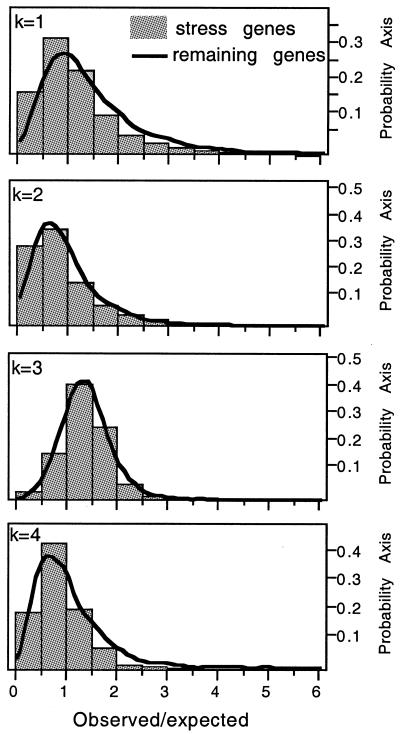
Figure 3.
Distribution of observed/expected values for SSR densities for k-tuples from 1 to 4, in the stress subset (bars) and in remaining genes of the genome (lines). Expected values were calculated using the observed number of SSRs in 1000 random sequences of equal length and equal frequency of the motif (see Materials and Methods).

