Figure 1.
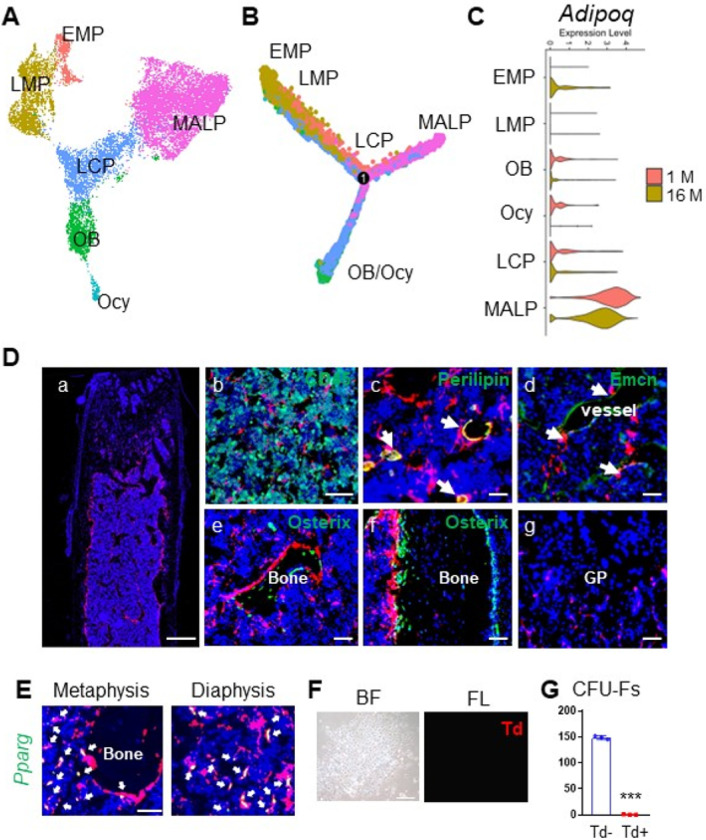
Adipoq labels MALPs in adult mice.
(A) The integrated scRNA-seq dataset of sorted bone marrow Td+ cells from 1 and 16-month-old Col2-Cre Td mice. The Uniform Manifold Approximation and Projection (UMAP) plot is presented to show cell clustering. EMP: early mesenchymal progenitor; LMP: late mesenchymal progenitor; LCP: lineage committed progenitor; OB: osteoblast; Ocy: osteocyte; MALP: marrow adipogenic lineage precursor.
(B) Monocle trajectory plots of bone marrow mesenchymal lineage cells. Cells are labeled according to their Seurat clusters.
(C) Violin plots of Adipoq in bone marrow cells in young and old mice.
(D) Representative fluorescent images of AdipoqER/Td mouse femur reveal many bone marrow Td+ cells. Mice at 3 months of age received Tam injections for 3 days and their bones were harvested at day 7. (a) A low magnification image of a distal femur. Scale bar=500 μm. (b-g) At a high magnification, Td labels CD45- stromal cells (b), Perilipin+ adipocytes (arrows, c), and pericytes (arrows, d), but does not label osteoblasts and osteocytes (e, f) and growth plate (GP) chondrocytes (g). Scale bar=50 μm.
(E) Fluorescent images of AdipoqER/Td mouse bone marrow stained for Pparg mRNA by RNA FISH. Scale bar=20 μm.
(F) CFU-F assay of bone marrow cells from AdipoqER/Td mice shows that all CFU-F colonies are made of Td- cells. BF: brightfield; FL: fluorescent light. Scale bar=50 μm.
(G) Quantification of the number of Td+ and Td- CFU-F colonies in 3 million bone marrow cells. ***: p<0.001, n=3 mice.

