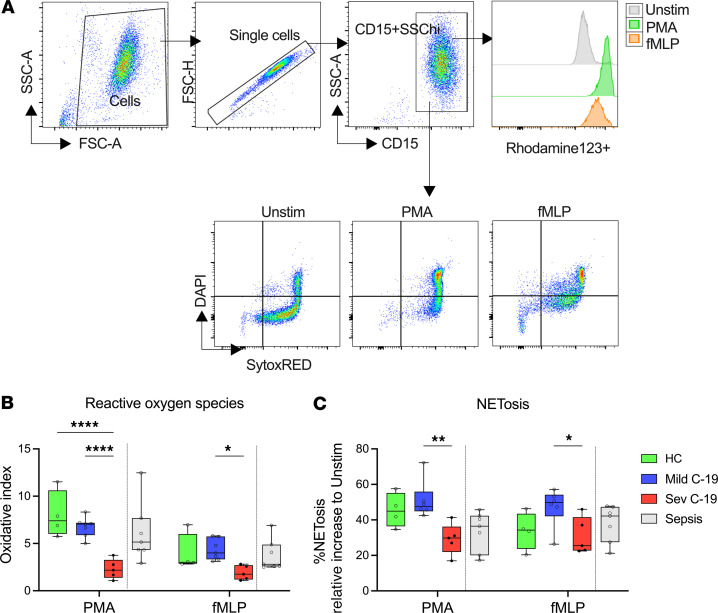
Figure 5. Neutrophils from patients with severe COVID-19 display impaired ROS and NET production.
Fresh neutrophils were isolated from healthy controls and patients with COVID-19 and stimulated with PMA or fMLP to induce ROS and NET production. (A) Gating strategy to quantify NETs and ROS production in neutrophils. (B) Fold-increase in ROS production in stimulated NDNs over unstimulated NDNs isolated from healthy controls (HC, n = 4) and patients with mild (n = 7) and severe (n = 5) COVID-19. (C) Percentage NETosis in NDNs stimulated with PMA or fMLP from HC (n = 4) and patients with mild (n = 6) and severe (n = 5) COVID-19. Solid black dots represent individuals with steroid exposure at the time of sampling. In panels B and C, the respective values in a contemporaneous cohort of patients with bacterial sepsis are shown in gray; these are not included in the statistical analysis and are shown for comparison purposes only. Statistical analysis was performed using 2-way ANOVA with Tukey’s multiple comparisons test. *P < 0.05; **P < 0.01; ****P < 0.0001. Median with IQR is shown.

