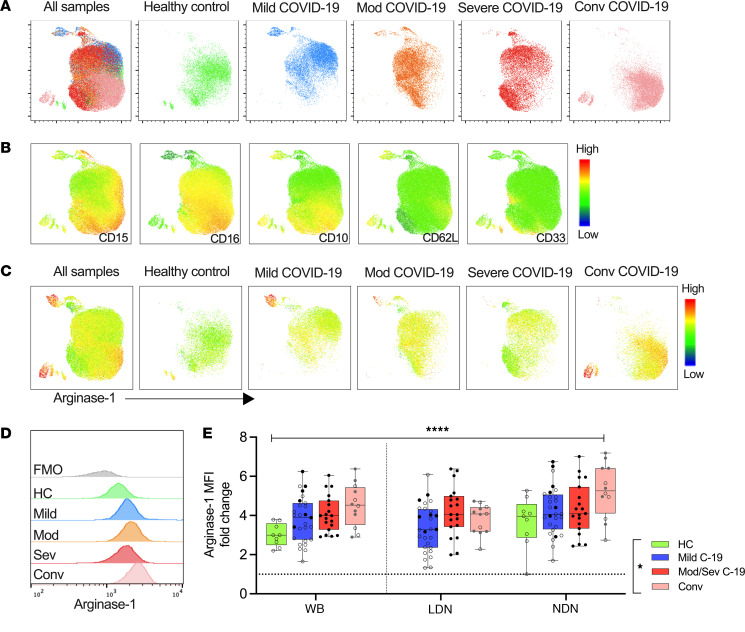
Figure 6. Neutrophil arginase-1 expression remains elevated throughout the COVID-19 disease course through to convalescence.
Fresh whole blood was obtained from healthy controls, mild, moderate, severe, and convalescent patients and stained for basal intracellular arginase-1 expression. An equal number of neutrophils from each study group was concatenated and visualized using UMAP. (A) UMAP of all samples and separate study groups (healthy controls [HC], n = 3; mild, n = 4; moderate, n = 4; severe, n = 4; and convalescent, n = 5) is shown. (B) MFI heatmaps showing individual surface marker expression projected onto the UMAP. (C) MFI heatmaps showing intracellular expression of arginase-1 projected onto the UMAP and stratified by disease severity. (D) Overlaid histogram plot of intracellular arginase-1 expression in different disease groups. FMO control is shown for reference. (E) Intracellular arginase-1 expression was quantified in whole blood neutrophils and LDN and NDN fractions from HC (n = 9) and mild (n = 28) and moderate/severe (n = 19) COVID-19 patients and convalescent (n = 12) individuals. The MFI fold-change relative to FMO is presented. Solid black dots and gray dots represent individuals with steroid exposure at the time of sampling and during active disease, respectively. Statistical analysis was performed using mixed effects analysis with Tukey’s multiple comparisons test. *P < 0.05; ****P < 0.001. Median with IQR is shown.

