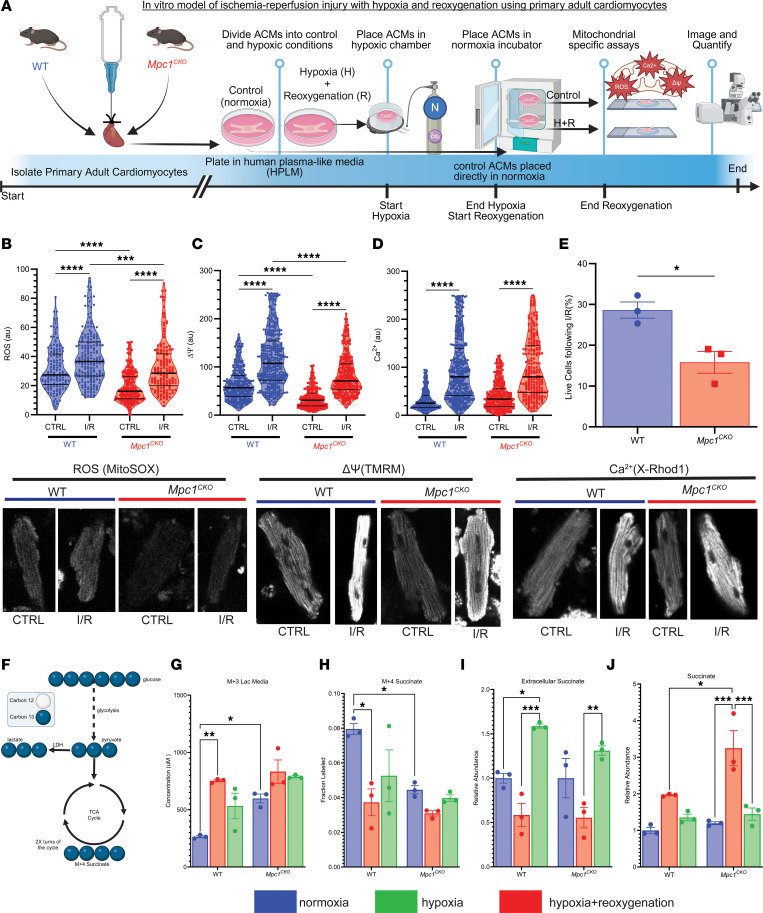
Figure 3. Mpc1CKO cardiomyocytes under simulated I/R exhibit greater mitochondrial damage, increased cell death, and more lactate/succinate flux.
(A) Schematic workflow for in vitro adult cardiomyocyte ischemic/reperfusion (hypoxia + reoxygenation) injury. (B–D) Mitochondrial ROS, membrane potential; ΔΨ, Ca2+ following I/R showing increases from control cells (CTRL: baseline) to I/R, with greater changes in the Mpc1CKO cells. Magnification, ×40. (E) Percentage of live cells following I/R injury. (F) Diagram of [U-13C]glucose tracing in primary ACMs. (G) Media M+3 lactate from shows Mpc1CKO cells efflux more lactate from glucose into the media at baseline. (H) Cellular M + 4 succinate labeling from [U-13C]glucose–treated cells (I) Extracellular succinate measured during reperfusion. (J) Relative intracellular abundance of succinate during ischemia in WT and Mpc1CKO. Unpaired t tests (E) and 2-way ANOVAs with a Tukeys HSD post hoc test (B–D and G–J) were used for statistical analysis between WT (n = 3) and Mpc1CKO (n = 3), and normoxia, hypoxia, and hypoxia with reoxygenation. *P < 0.05, **P < 0.01, ***P < 0.001, ****P < 0.0001. Values are represented as mean±SEM. BioRender was used to make panels A and F.

