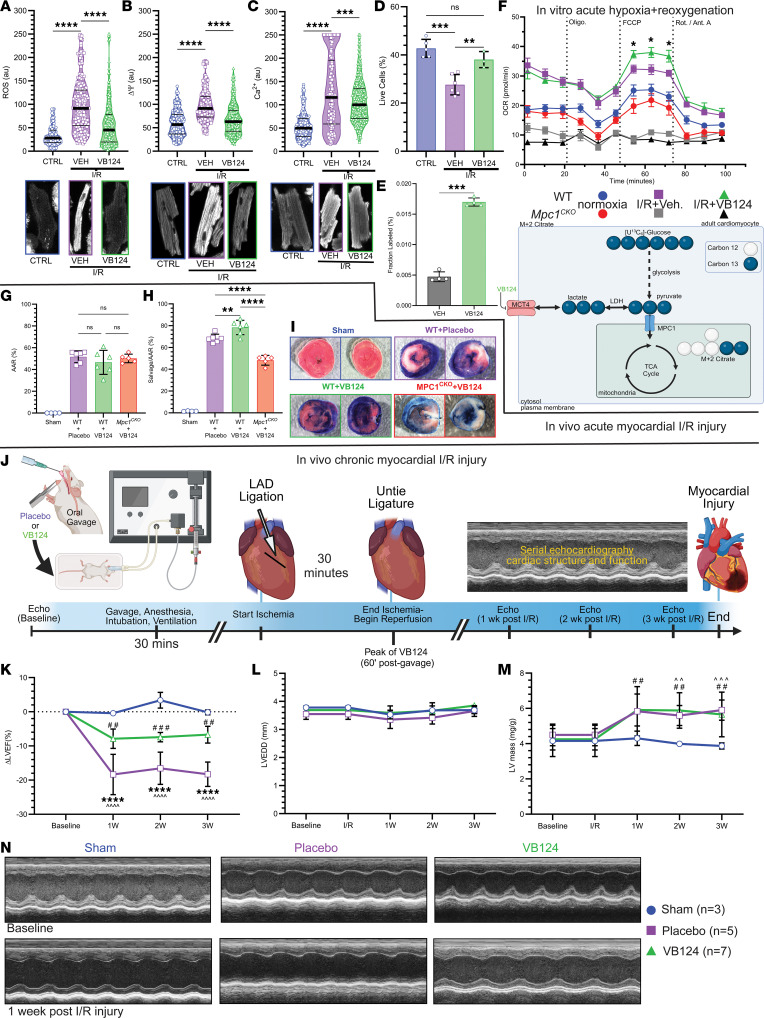
Figure 4. MCT4 inhibition alleviates I/R injury.
(A) Mitochondrial ROS (B), membrane potential; ΔΨ (C), Ca2+ following hypoxia + reoxygenation with VB124 showing increases from baseline to I/R, and improvement with VB124 (normoxia: n = 5, –VB124: n = 6, +VB124: n = 3). (D) VB124 mitigates cell death following I/R injury. (E) M + 2 citrate labeling from [U-13C]glucose tracing in ACMs following hypoxia + reoxygenation with MCT4-inhibition (VB124) or Vehicle (DMSO) controls (n = 4, each). (F) Seahorse assay showing hypoxia + reoxygenation impairs Mpc1CKO mitochondrial respiration (normoxia: n = 6, vehicle: n = 7, VB124: n = 6) and VB124 (n = 9) improves maximal oxygen consumption rates in WT ACMs compared with Vehicle-treated WT ACMs (vehicle: n = 10, normoxia: n = 9). (G) Following I/R, the area at risk (AAR %) is nonsignificant, indicating similar injury between placebo, +VB124, and Mpc1CKO + VB124 groups (Sham: n = 4, Placebo: n = 6, VB124: n = 6, Mpc1CKO + VB124: n = 5). (H) Within the area at risk, myocardial salvage is significantly increased in C57BL/6J mice (n = 6), but not the Mpc1CKO (n = 5) gavaged with VB124, after I/R injury when compared with placebo (n = 6). (I) Representative images of myocardial salvage and necrosis following I/R injury in sham (n = 4), placebo (n = 6), +VB124 (n = 6), and Mpc1CKO+VB124 (n = 5) groups. Magnification, × 40(J) Schematic representation of in vivo chronic myocardial I/R injury with the placebo (methylcellulose) or VB124 oral gavage. (K–N) Following I/R injury, serial echocardiography was performed to assess cardiac function (left ventricular ejection fraction; LVEF) and structure (left ventricular end-diastolic diameter; LVEDD and left ventricular mass; LV mass). Unpaired t tests (E and F), and 1-way (A–D, G–H, and K–M) ANOVAs with a Tukey’s HSD post hoc test were used for statistical analysis. (A–G) **P < 0.01, ***P < 0.001, ****P < 0.0001. (J) ****P < 0.0001, placebo compared with VB124. (L) ##P < 0.01, VB124 compared with sham. ^^P < 0.01, placebo compared with sham. ^^^P < 0.001, placebo compared with sham. Values are represented as mean±SD. BioRender was used to make panels E and J.

