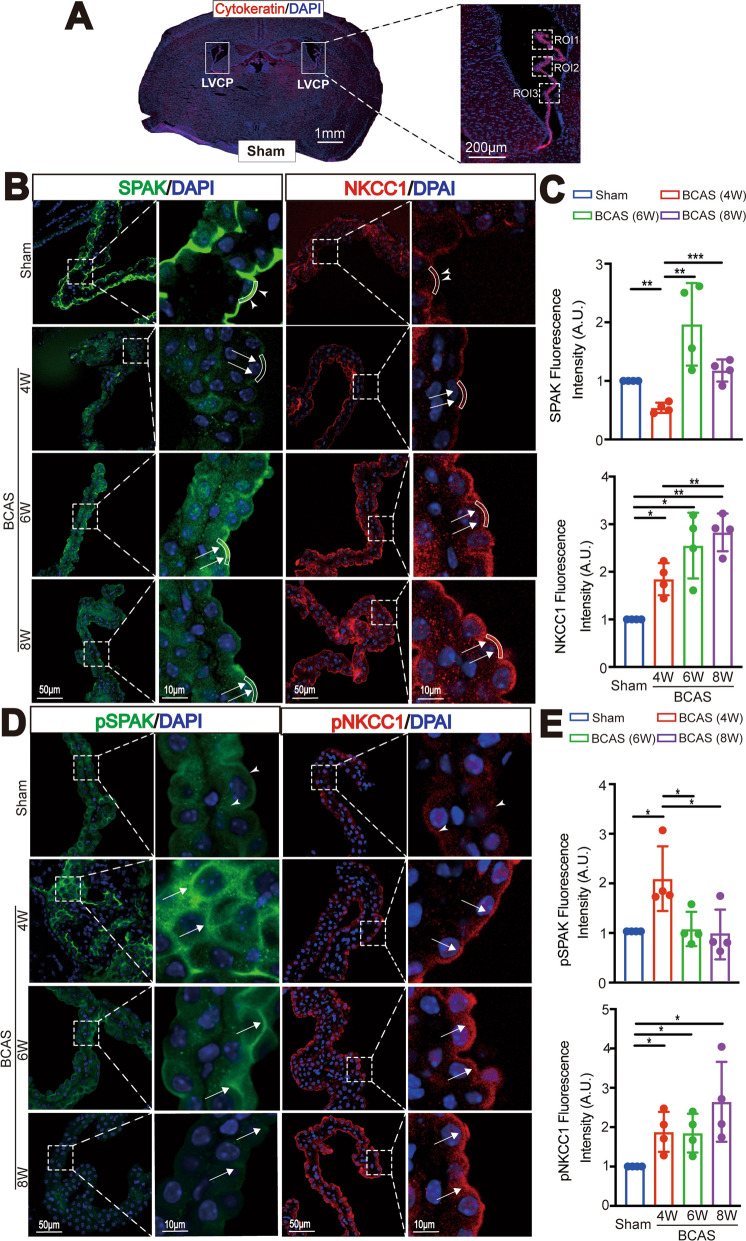
Fig. 2.
BCAS induces dynamic changes of ChP SPAK-NKCC1 complex protein expression. A Representative images of left and right LVCP of Sham brains stained for epithelial cytoskeletal cytokeratin protein. Dashed box: ROI for data quantification. B Representative images of immunofluorescent staining of SPAK and NKCC1 proteins in LVCP of Sham or BCAS mice at 4, 6, or 8 weeks after surgery. Arrowheads: ROI of apical membrane SPAK or NKCC1 protein expression. Arrows: BCAS-induced changes of SPAK and NKCC1 protein. C Quantification analysis of SPAK and NKCC1 immunofluorescence intensity in each group. Data are expressed as mean ± SD. n = 4 mouse brains. *p < 0.05, **p < 0.01, ***p < 0.001. One Sample t-test. Unpaired t-test. D Representative immunofluorescent staining images of phosphorylated SPAK (pSPAK), and NKCC1 protein (pNKCC1) in LVCP. Arrowheads: apical membrane expression of pSPAK or pNKCC1 protein. Arrows: BCAS-induced changes of pSPAK and pNKCC1 protein expression. E Quantification analysis of pSPAK and pNKCC1 immunofluorescence intensity in each group. Data are expressed as mean ± SD. n = 4 mouse brains. *p < 0.05. One Sample t-test. Unpaired t-test

