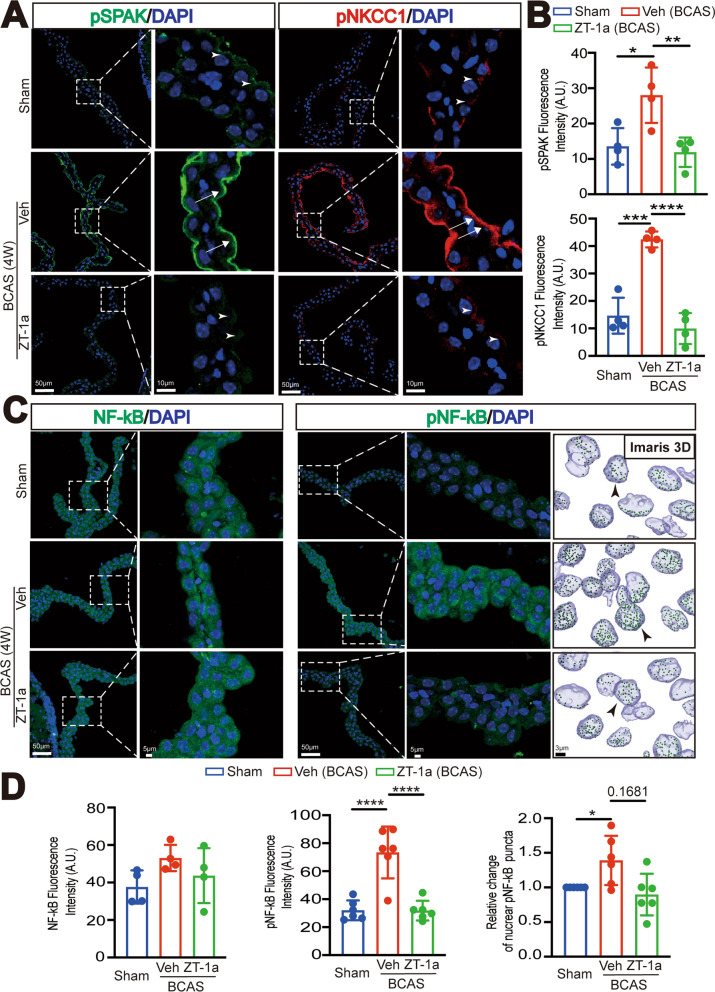
Fig. 4.
ZT-1a treatment at 2–4 weeks post-BCAS attenuates SPAK-NKCC1 complex and pNF-kB activation. A Representative immunofluorescent staining image of pSPAK and pNKCC1 in the Sham or BCAS + Veh, BCAS + ZT-1a LVCPs. Arrowheads: low level expression of pSPAK or pNKCC1. Arrows: elevated pSPAK or pNKCC1 expression. B Quantification summary. Data are mean ± SD (n = 4 mice). *p < 0.05, **p < 0.01, ***p < 0.001, ****p < 0.0001. One-way analysis of variance (ANOVA). C. Representative immunofluorescent staining Max IP image of NF-κB and pNF-κB, and 3D cell reconstruction images of nuclear pNF-kB. D Quantification summary. Data are mean ± SD (n = 4–6 mice). *p < 0.05, ****p < 0.0001 vs Sham. One-way analysis of variance (ANOVA), One Sample t-test or unpaired t-test

