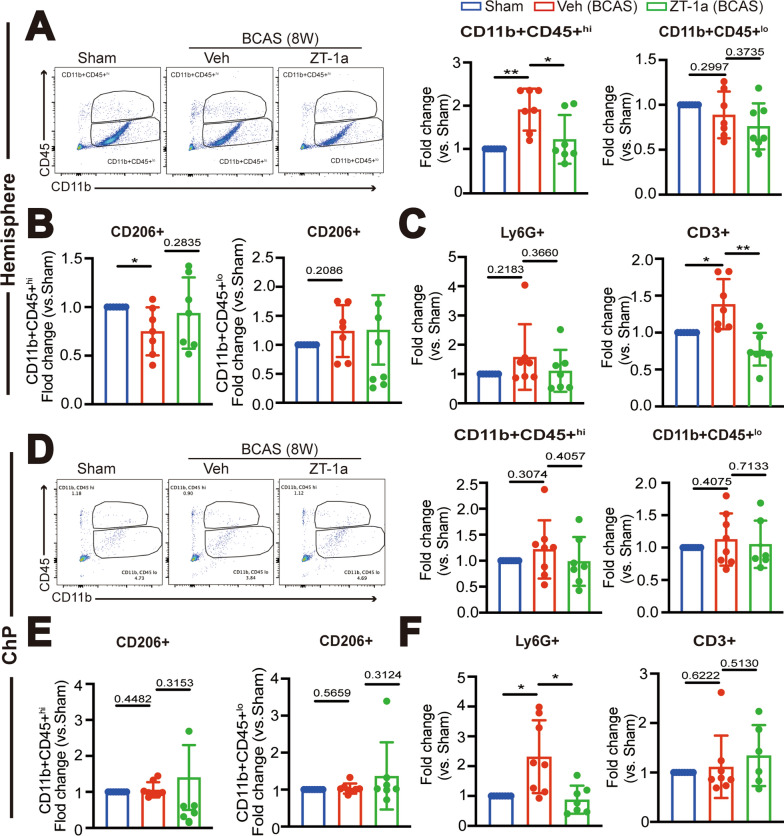
Fig. 7.
ZT-1a treatment at 4–8 weeks post-BCAS attenuated chronic immune cell infiltration into the hemisphere and ChP. A Representative flow cytometric plots of CD11b + CD45 + hi or CD11b+CD45+lo myeloid cells in the single cells from hemisphere at 8-weeks post-surgery. Data are mean ± SD (n = 7 mice). *P < 0.05, **p < 0.01. One Sample t-test. Unpaired t-test. B Fold changes of anti-inflammation CD11b+CD45+hi/CD206+ and CD11b + CD45+lo/CD206+ cells. Data are mean ± SD (n = 7 mice). *p < 0.05. One Sample t-test. Unpaired t-test. C Fold changes of total number of CD3+ lymphocyte and CD11b+CD45+/Ly6G+ neutrophils. Data are mean ± SD (n = 7 mice). *p < 0.05, ** p < 0.01. One Sample t-test. Unpaired t-test. D Representative flow cytometric plots of CD11b+CD45+hi or CD11b + CD45+lo myeloid cells from the LVCP and the percentage in the single cells. Data are mean ± SD (n = 7–8 mice). One Sample t-test. Unpaired t-test. E Fold changes of anti-inflammatory CD11b+CD45+hi/CD206+ and CD11b+CD45+lo/CD206+ cells. Data are mean ± SD (n = 7–8 mice), p > 0.05. One Sample t-test. Unpaired t-test. F Fold changes of CD3+ lymphocyte and CD11b+CD45+/Ly6G+ neutrophils in the single cells. Data are mean ± SD (n = 7–8 mice), *p < 0.05. One Sample t-test. Unpaired t-test

