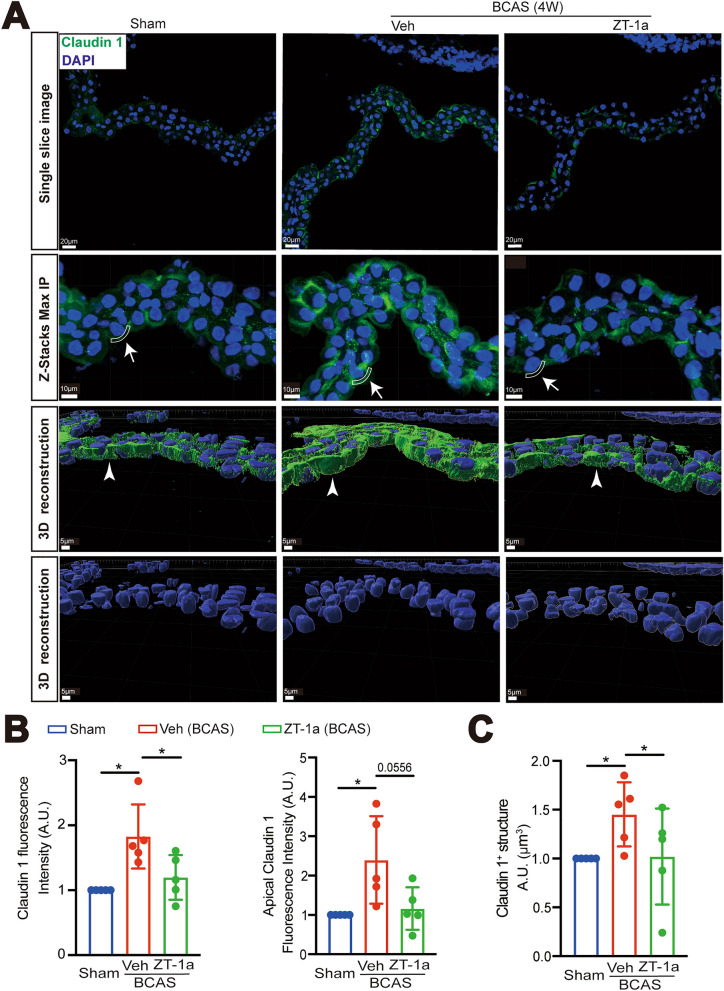
Fig. 8.
Effects of ZT-1a on changes of ChP TJ protein expression after BCAS. A Representative immunofluorescent staining of claudin-1 in the sham, BCAS + Veh, or BCAS + ZT-1a brains (2–4 weeks post-BCAS) treatment in single-layer images, Z-Stacks Max IP, and 3D cell reconstruction of immunofluorescent staining images derived from these Z-stacks. Arrows and sector-shaped boxes: the ectopic localization of claudin-1 at the apical membrane of the ChP epithelial cells; Arrowheads: expression of claudin-1. B Quantification summary. Data are mean ± SD (n = 5 mice). *p < 0.05. One Sample t-test. Unpaired t-test. C Quantification summary. Data are mean ± SD (n = 5 mice). *p < 0.05. One Sample t-test. Unpaired t-test

